Inferring Intraspecific Competition from Leaf Gall Spatial Patterns
Introduction
In ecological systems, spatial distribution patterns yield vital clues regarding underlying biological interactions, including intraspecific competition, mutualism, microhabitat heterogeneity, and resource partitioning. Broadly, three canonical spatial dispersion patterns occur in natural populations:
- Random Distribution: Typically characterizes resource-rich, homogeneous environments where individuals establish independently without strong competitive interference or social attraction.
- Regular (Uniform) Distribution: Characterized by even, maximized inter-individual distances, typically generated by direct competitive antagonism, territorial exclusion, or local resource depletion.
- Aggregated (Clustered) Distribution: Characterized by spatial clumping around microenvironmental resource patches, localized dispersal vectors, or social aggregation.
In this study, we analyzed the spatial dispersion of insect-induced leaf galls across 12 leaves of the scholar tree (Alstonia scholaris) using the classical Clark–Evans Nearest Neighbour Method (Clark and Evans, 1954).
Materials and Methods
Materials
- 12 freshly collected leaves of Alstonia scholaris displaying insect galls
- Standard millimeter graph sheets
- Transparent acetate overlays and fine archival markers
- Vernier caliper (0.01 mm resolution)
Methods
Leaf boundaries and individual gall coordinates were traced onto transparent acetate overlays. Lamina surface area (
Using a Vernier caliper, the distance
Mathematical Formulation
Gall Density (
): Where
is total gall count and is lamina area ( ). Observed Mean Nearest Neighbour Distance (
): Expected Mean Distance for a Poisson Random Distribution (
): Clark–Evans Dispersion Ratio (
): Dispersion Classification:
- Clustered / Aggregated:
- Random:
(theoretical expectation ) - Regular / Uniform:
(theoretical maximum hexagonal packing )
- Clustered / Aggregated:
Data
Leaf Area and Gall Enumeration
| Leaf ID | Leaf Area (cm²) | Number of Galls |
|---|---|---|
| Leaf 1 | 41 | 15 |
| Leaf 2 | 49 | 6 |
| Leaf 3 | 38 | 8 |
| Leaf 4 | 54 | 14 |
| Leaf 5 | 44 | 17 |
| Leaf 6 | 48 | 24 |
| Leaf 7 | 86 | 9 |
| Leaf 8 | 50 | 5 |
| Leaf 9 | 53 | 17 |
| Leaf 10 | 31 | 15 |
| Leaf 11 | 33 | 9 |
| Leaf 12 | 35 | 10 |
Leaf Area vs. Clark–Evans Dispersion Ratio (
| Leaf ID | Leaf Area (cm²) | Observed | Expected | Inferred Pattern | |
|---|---|---|---|---|---|
| Leaf 1 | 41 | 0.9047 | 0.8266 | 1.0945 | Random |
| Leaf 2 | 49 | 1.2300 | 1.4289 | 0.8602 | Random |
| Leaf 3 | 38 | 1.0475 | 1.0909 | 0.9599 | Random |
| Leaf 4 | 54 | 0.7636 | 0.9815 | 0.7779 | Random |
| Leaf 5 | 44 | 0.7506 | 0.8046 | 0.9328 | Random |
| Leaf 6 | 48 | 0.8087 | 0.7071 | 1.1440 | Random |
| Leaf 7 | 86 | 1.4900 | 1.5459 | 0.9638 | Random |
| Leaf 8 | 50 | 2.7860 | 1.5811 | 1.7621 | Regular |
| Leaf 9 | 53 | 0.7665 | 0.8824 | 0.8686 | Random |
| Leaf 10 | 31 | 0.7467 | 0.7188 | 1.0388 | Random |
| Leaf 11 | 33 | 0.7411 | 0.9574 | 0.7735 | Random |
| Leaf 12 | 35 | 1.2510 | 0.9354 | 1.3364 | Random |
Results
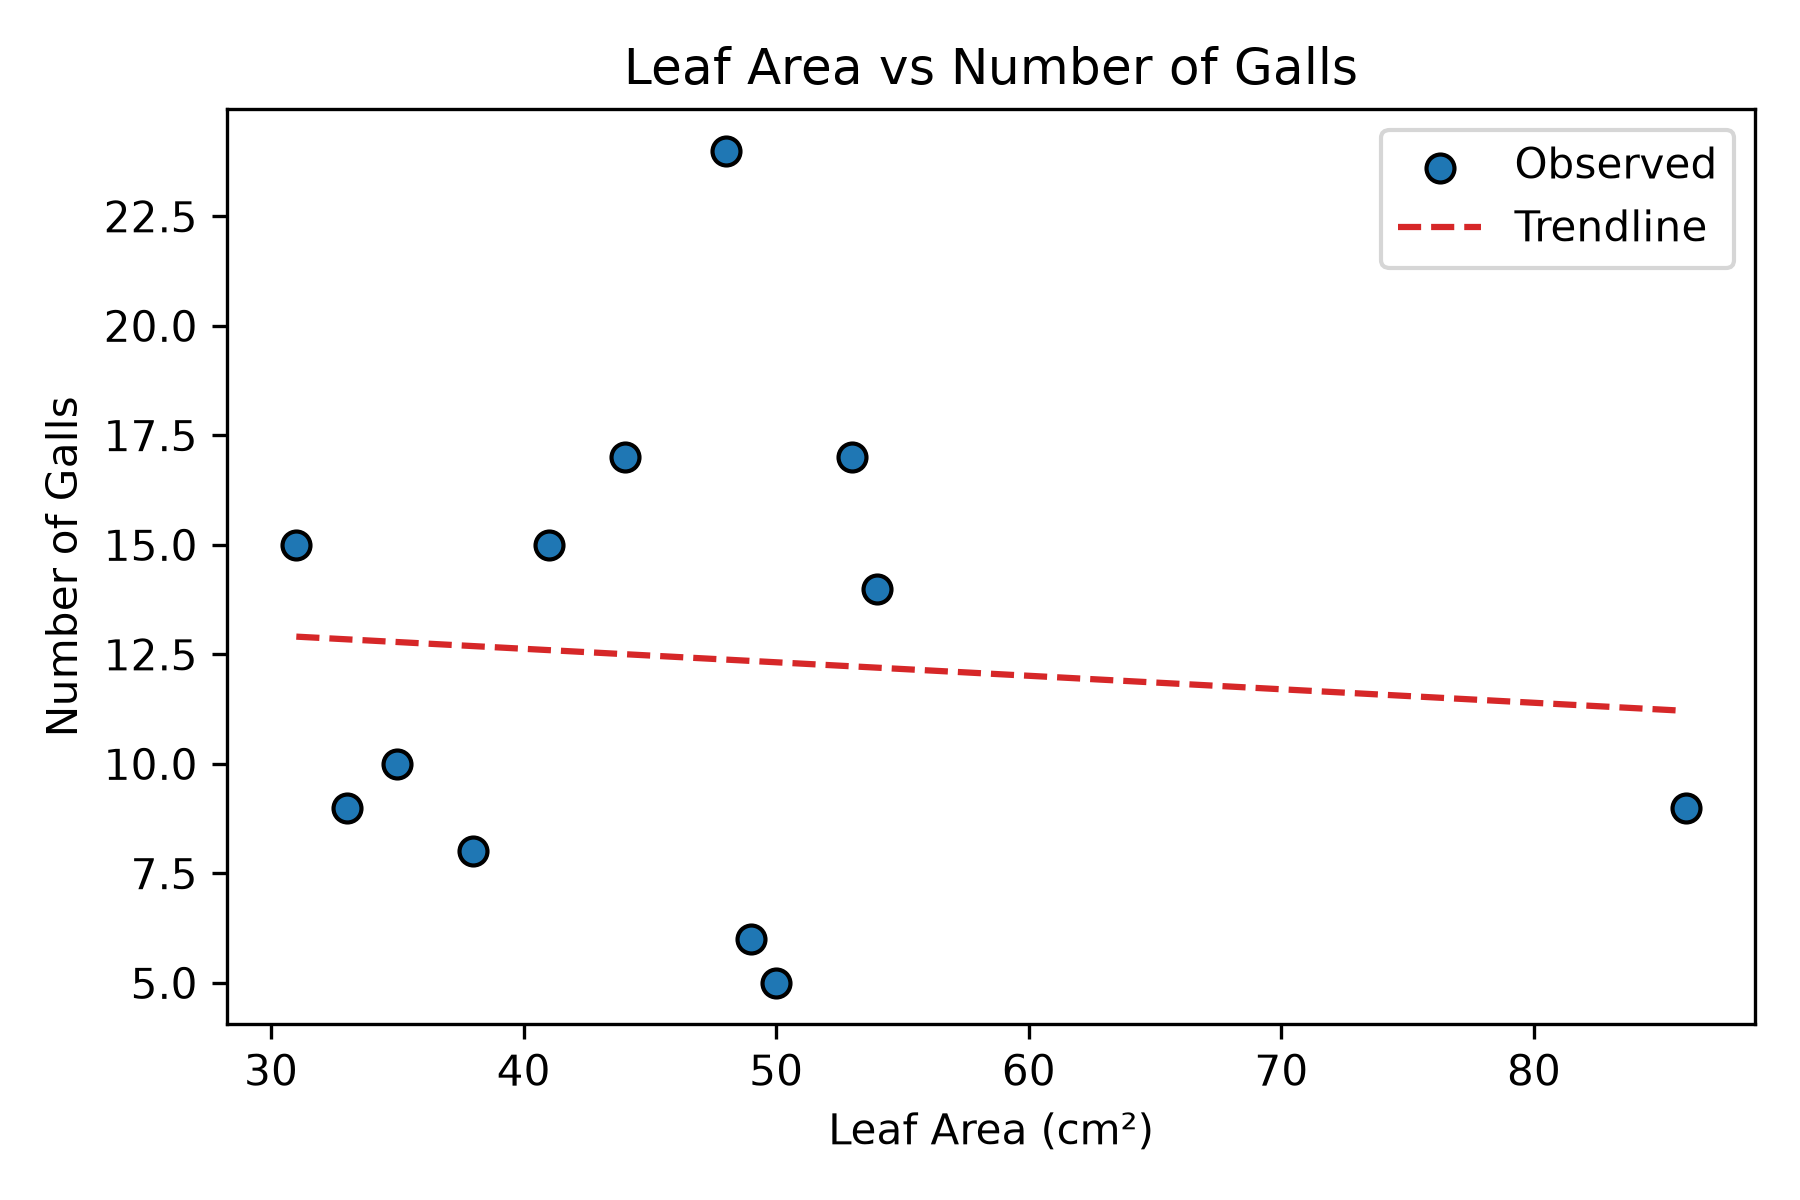 | 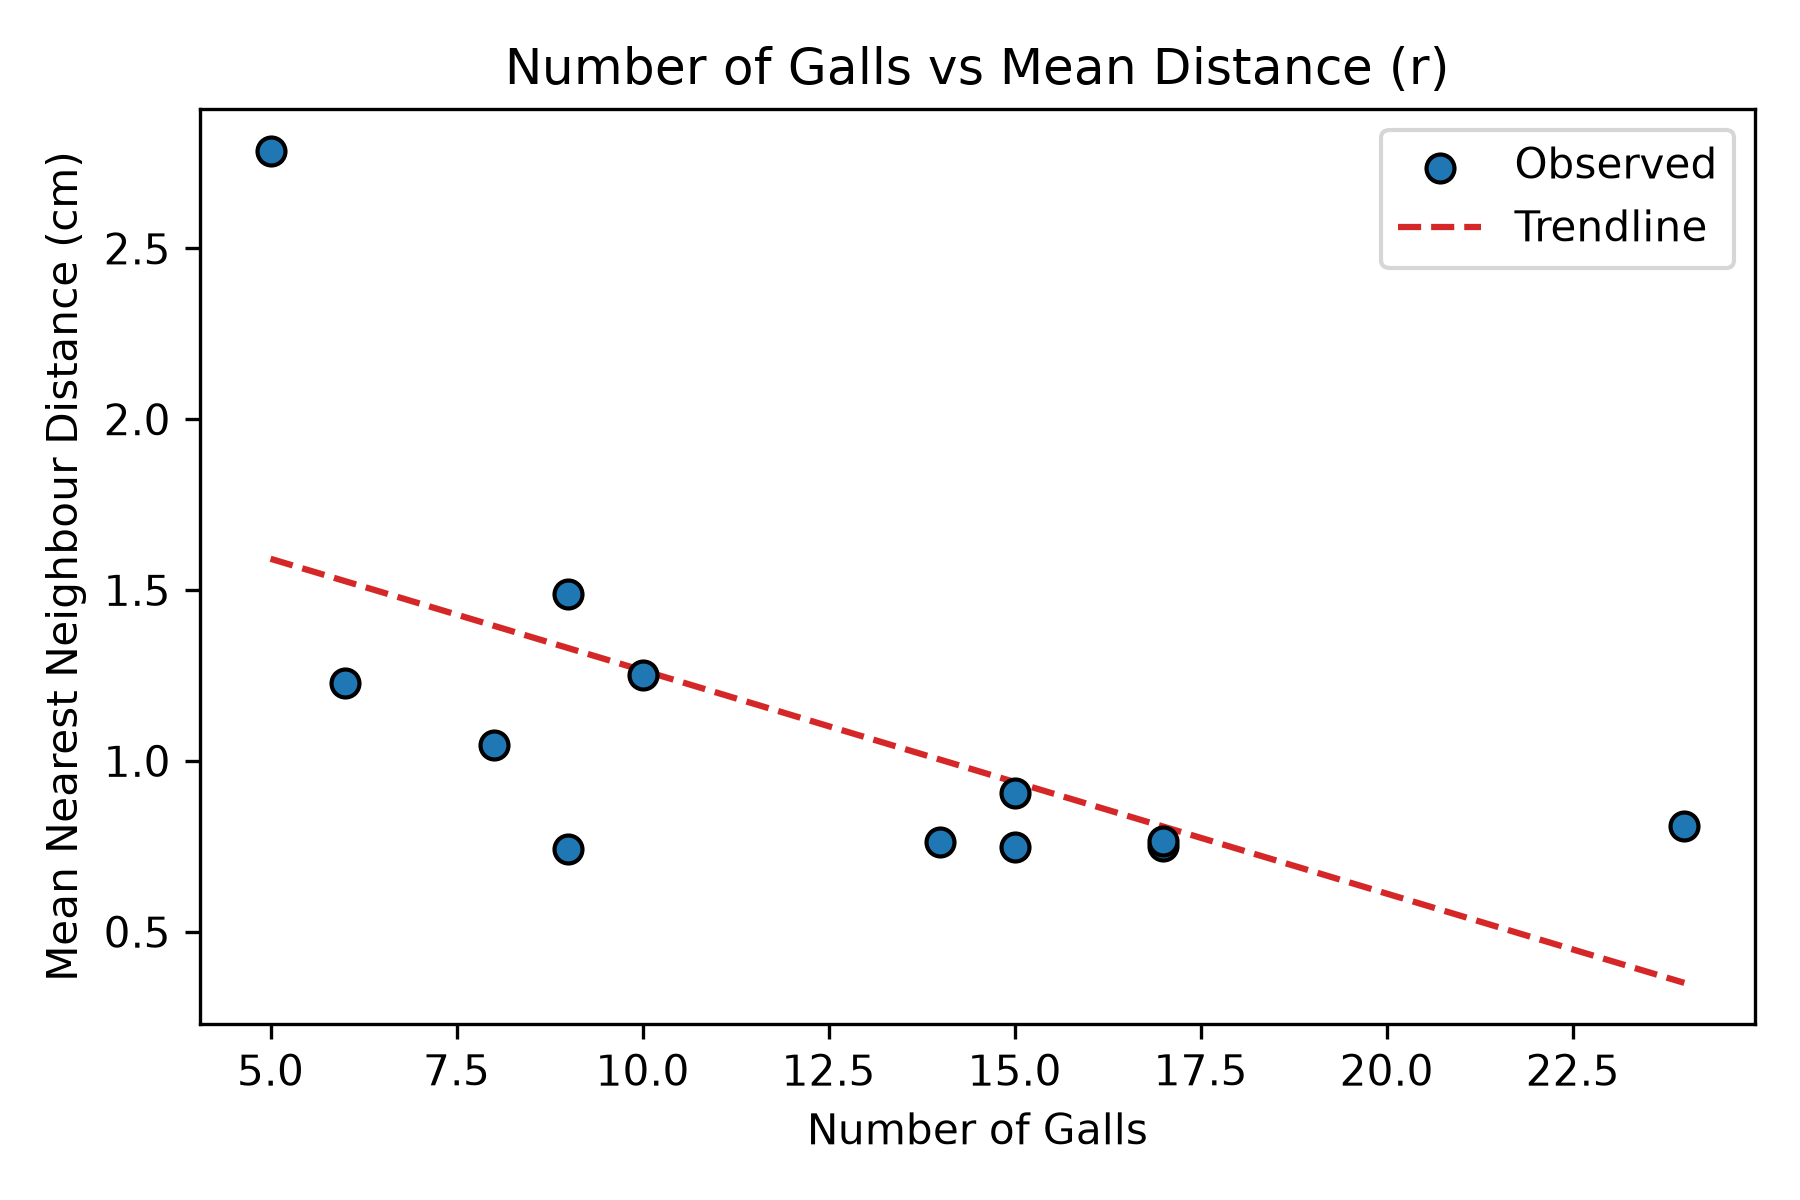 |
|---|---|
| Gall abundance vs. leaf area ( | Nearest neighbour distance vs. gall count ( |
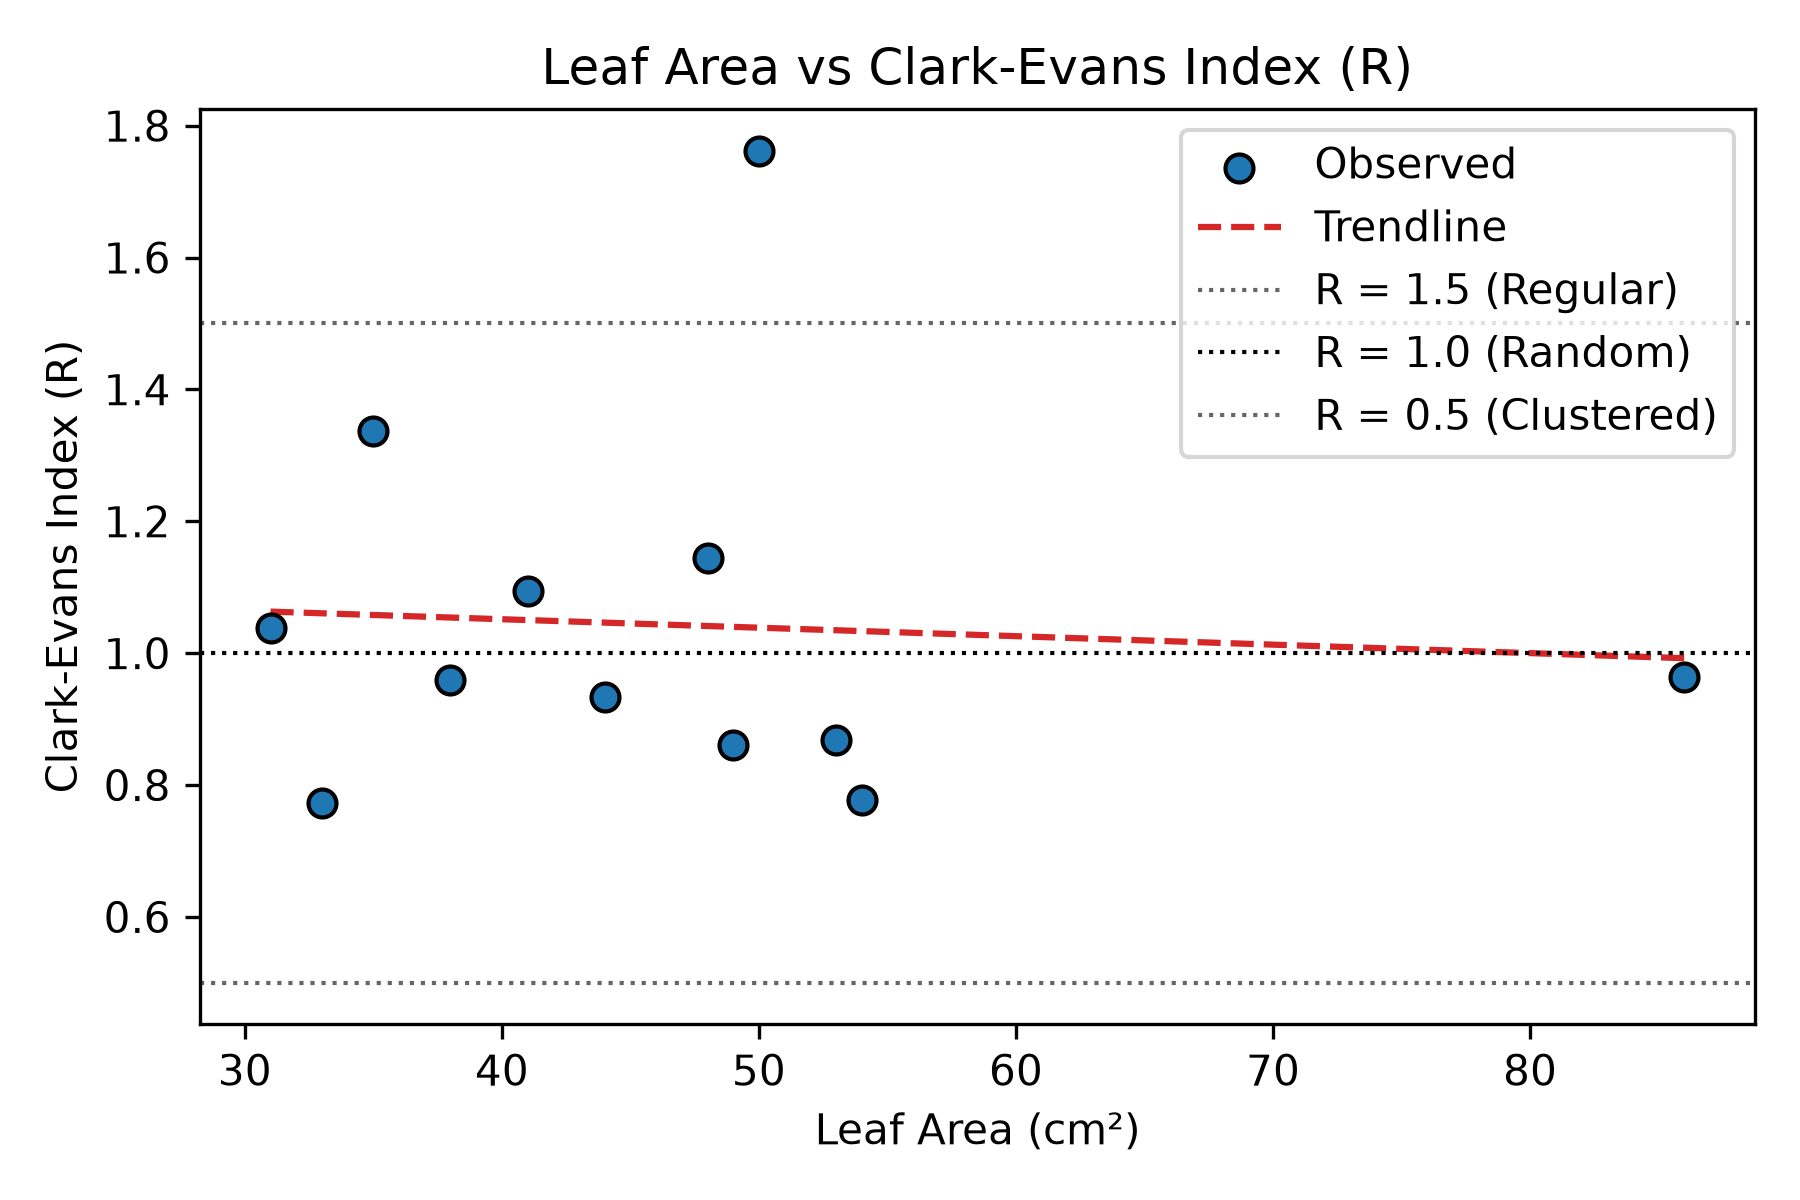 | 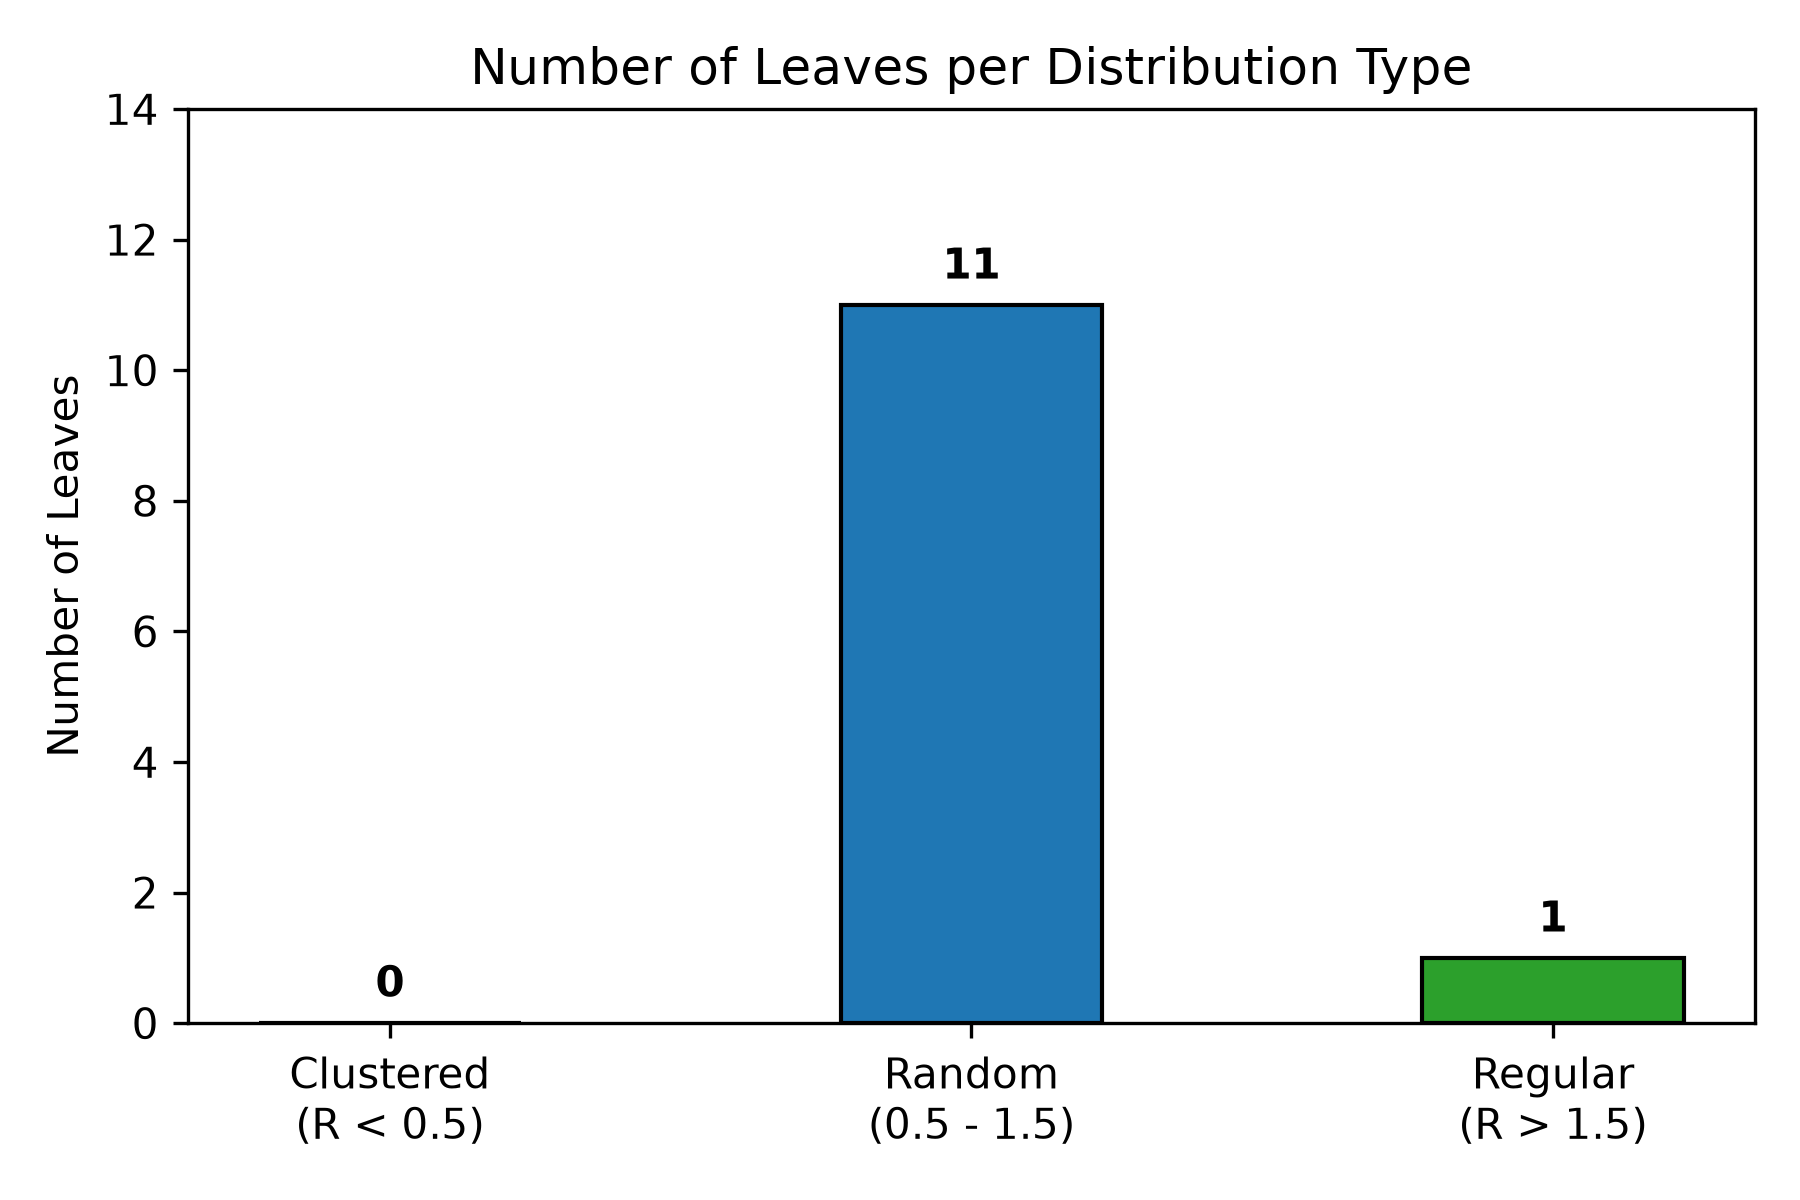 |
| Clark-Evans | Distribution classifications across the 12 sampled leaves |
Statistical Correlation Analyses
- Leaf Area vs. Gall Abundance:
Spearman's rank correlation coefficientconfirms no correlation between leaf size and total gall infestation. - Gall Abundance vs. Mean Nearest Neighbour Distance:
Spearman's rank correlation coefficientdemonstrates a statistically significant negative relationship ( ): higher gall infestation directly forces tighter physical packaging. - Scale Invariance of Dispersion Ratio:
Spearman's rank correlation between leaf area and Clark–Evans ratioconfirms that spatial dispersion pattern is scale-invariant across leaves.
Discussion and Conclusion
Across the 12 examined leaves:
- 11 leaves (91.7%) exhibited
values firmly within the random distribution envelope ( , centered near ). - 1 leaf (8.3%, Leaf 8) displayed a regular distribution (
). - 0 leaves exhibited clustered distributions (
).
The predominant random distribution pattern indicates that Alstonia scholaris leaf laminas act as homogeneous oviposition substrates for the gall-inducing insects. Oviposition appears to be Poisson-distributed across available lamina tissue rather than clustered around localized structural features or spaced through aggressive territorial deterrence.
References
- Clark, P.J. and Evans, F.C. (1954). Distance to nearest neighbor as a measure of spatial relationships in populations. Ecology, 35(4), pp. 445–453.
- Dale, M.R. and Fortin, M.J. (2014). Spatial Analysis: A Guide for Ecologists. Cambridge University Press.