Forward Genetics: Screening Temperature-Sensitive Mutants
Introduction
Forward genetics is a classical molecular genetics approach used to identify the genetic basis of a specific phenotype. In this methodology, random mutations are induced across a population, individuals exhibiting phenotypic alterations of interest are isolated through phenotypic screening, and their genetic lesions are subsequently mapped and characterized.
In this study, Escherichia coli (strain OP50) and Pseudomonas aeruginosa (strain PA14) were subjected to UV-induced mutagenesis to screen for temperature-sensitive conditional mutants that fail to proliferate at restrictive temperatures (30°C vs. 37°C).
Central Aim
Over a four-week experimental pipeline, we conducted:
- UV mutagenesis across systematic exposure intervals on E. coli OP50 and P. aeruginosa PA14.
- Replica plating to isolate temperature-sensitive mutant candidates.
- Microplate spectrophotometric growth kinetics (quantitative OD600 curves at 30°C and 37°C).
- Qualitative spot dilution assays and soft agar motility assays comparing mutant lines to wild-type controls.
Materials and Methods
Materials
- LB-Amp agar plates and liquid LB media
- Ampicillin stock solution (50 µg/mL)
- Overnight cultures of E. coli OP50 and P. aeruginosa PA14
- Laminar flow hood equipped with UV-C irradiation chamber
- Cylindrical replica plating block and sterile velveteen cloths
- 96-well microtiter plates and spectrophotometric plate reader
- 24-well culture plates and 0.3% soft agar motility plates
- Cryovials and 50% sterile glycerol for -80°C archiving
Methods
UV-Induced Mutagenesis
Overnight bacterial suspensions were serially diluted to
Replica Plating and Temperature-Sensitive Screening
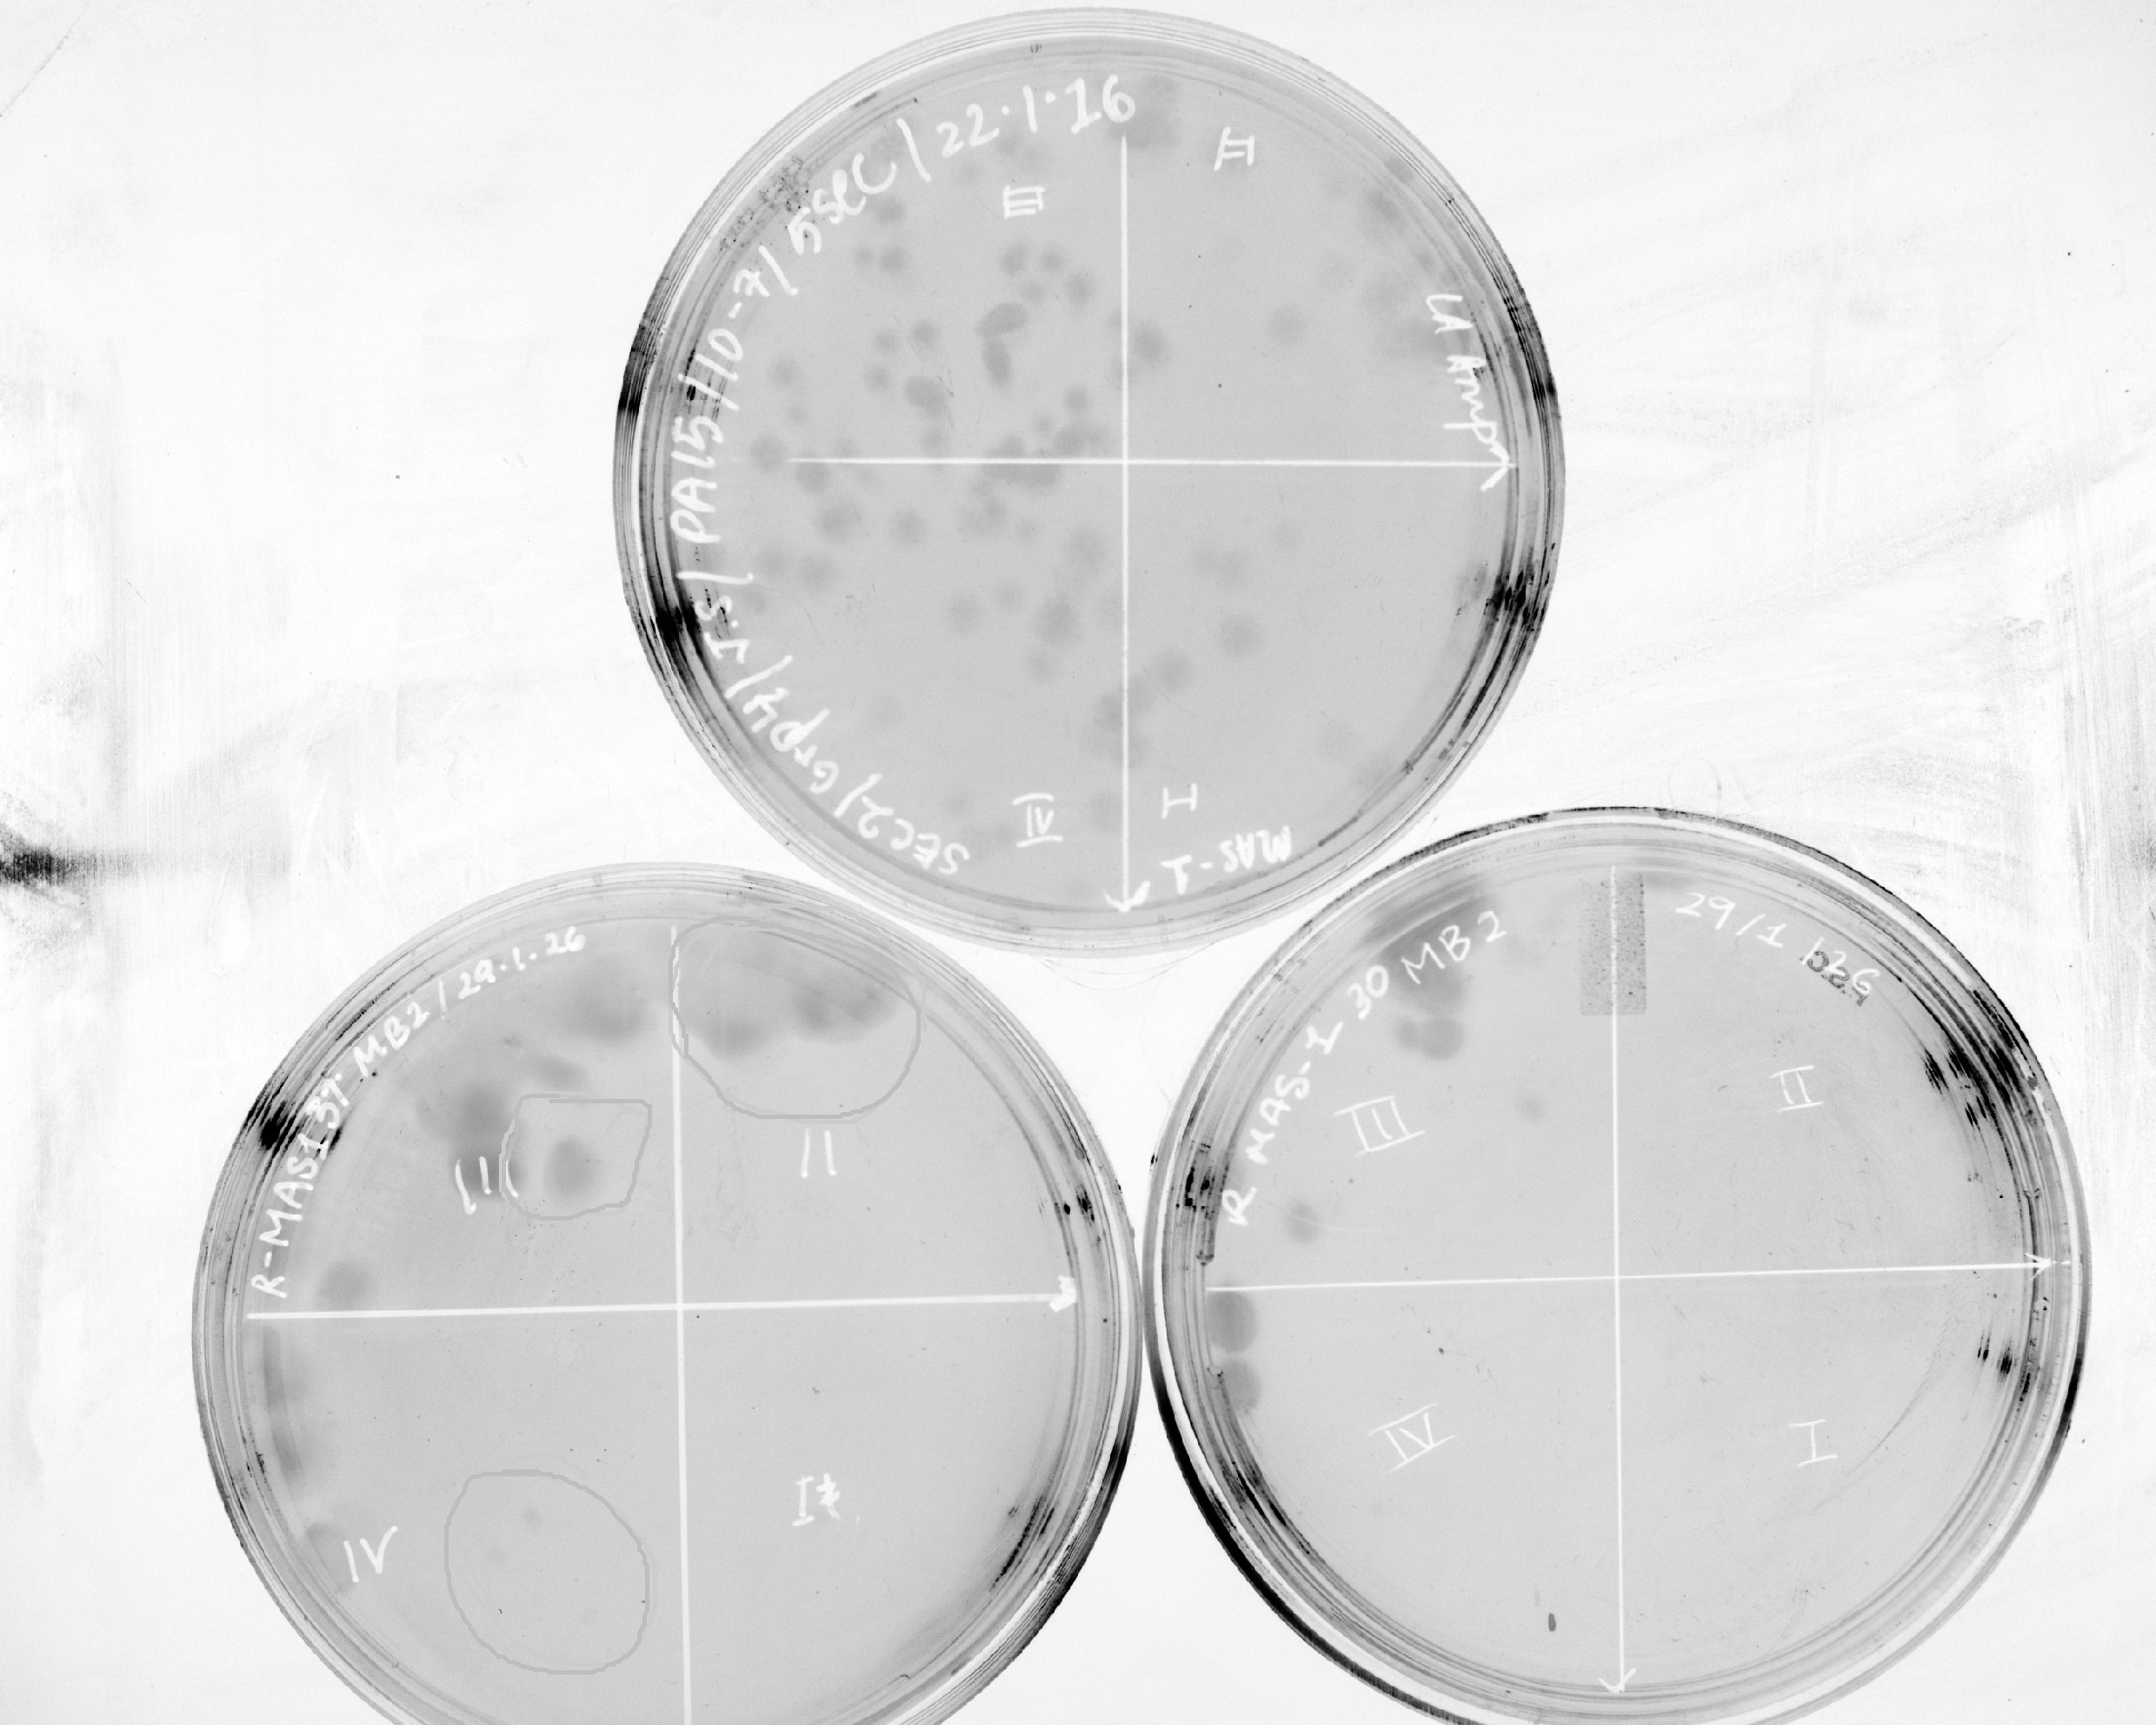
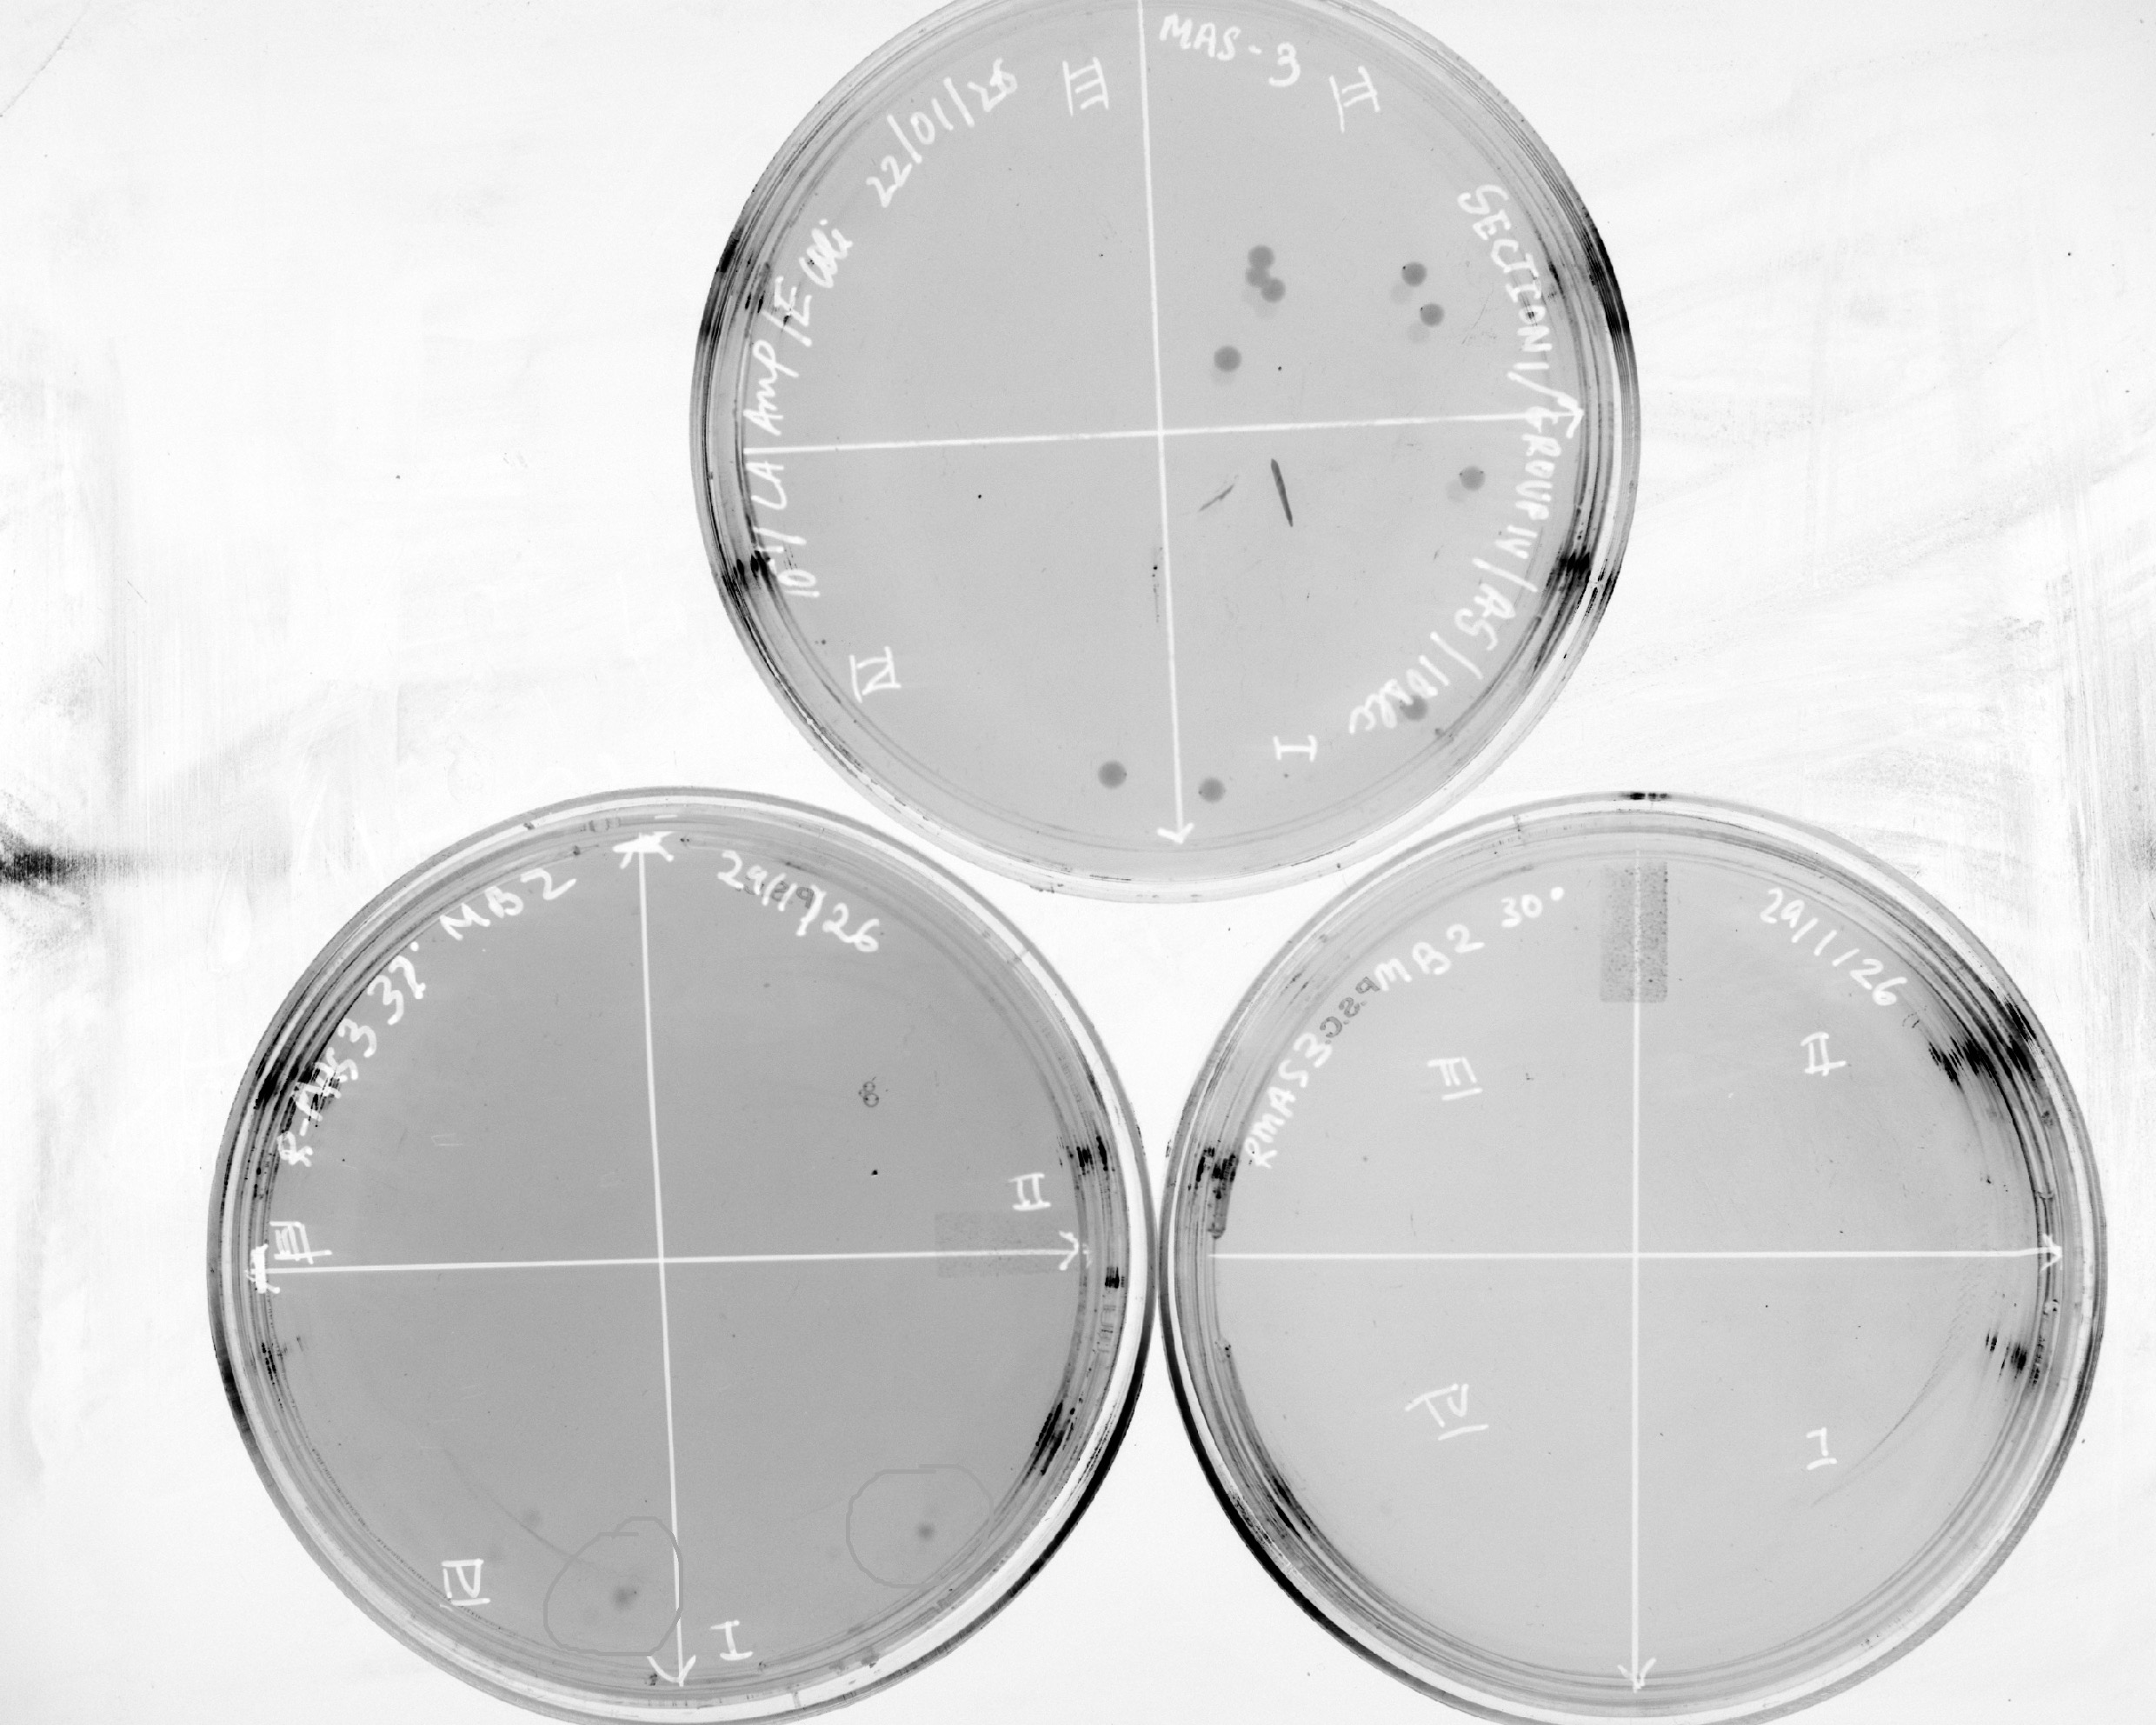
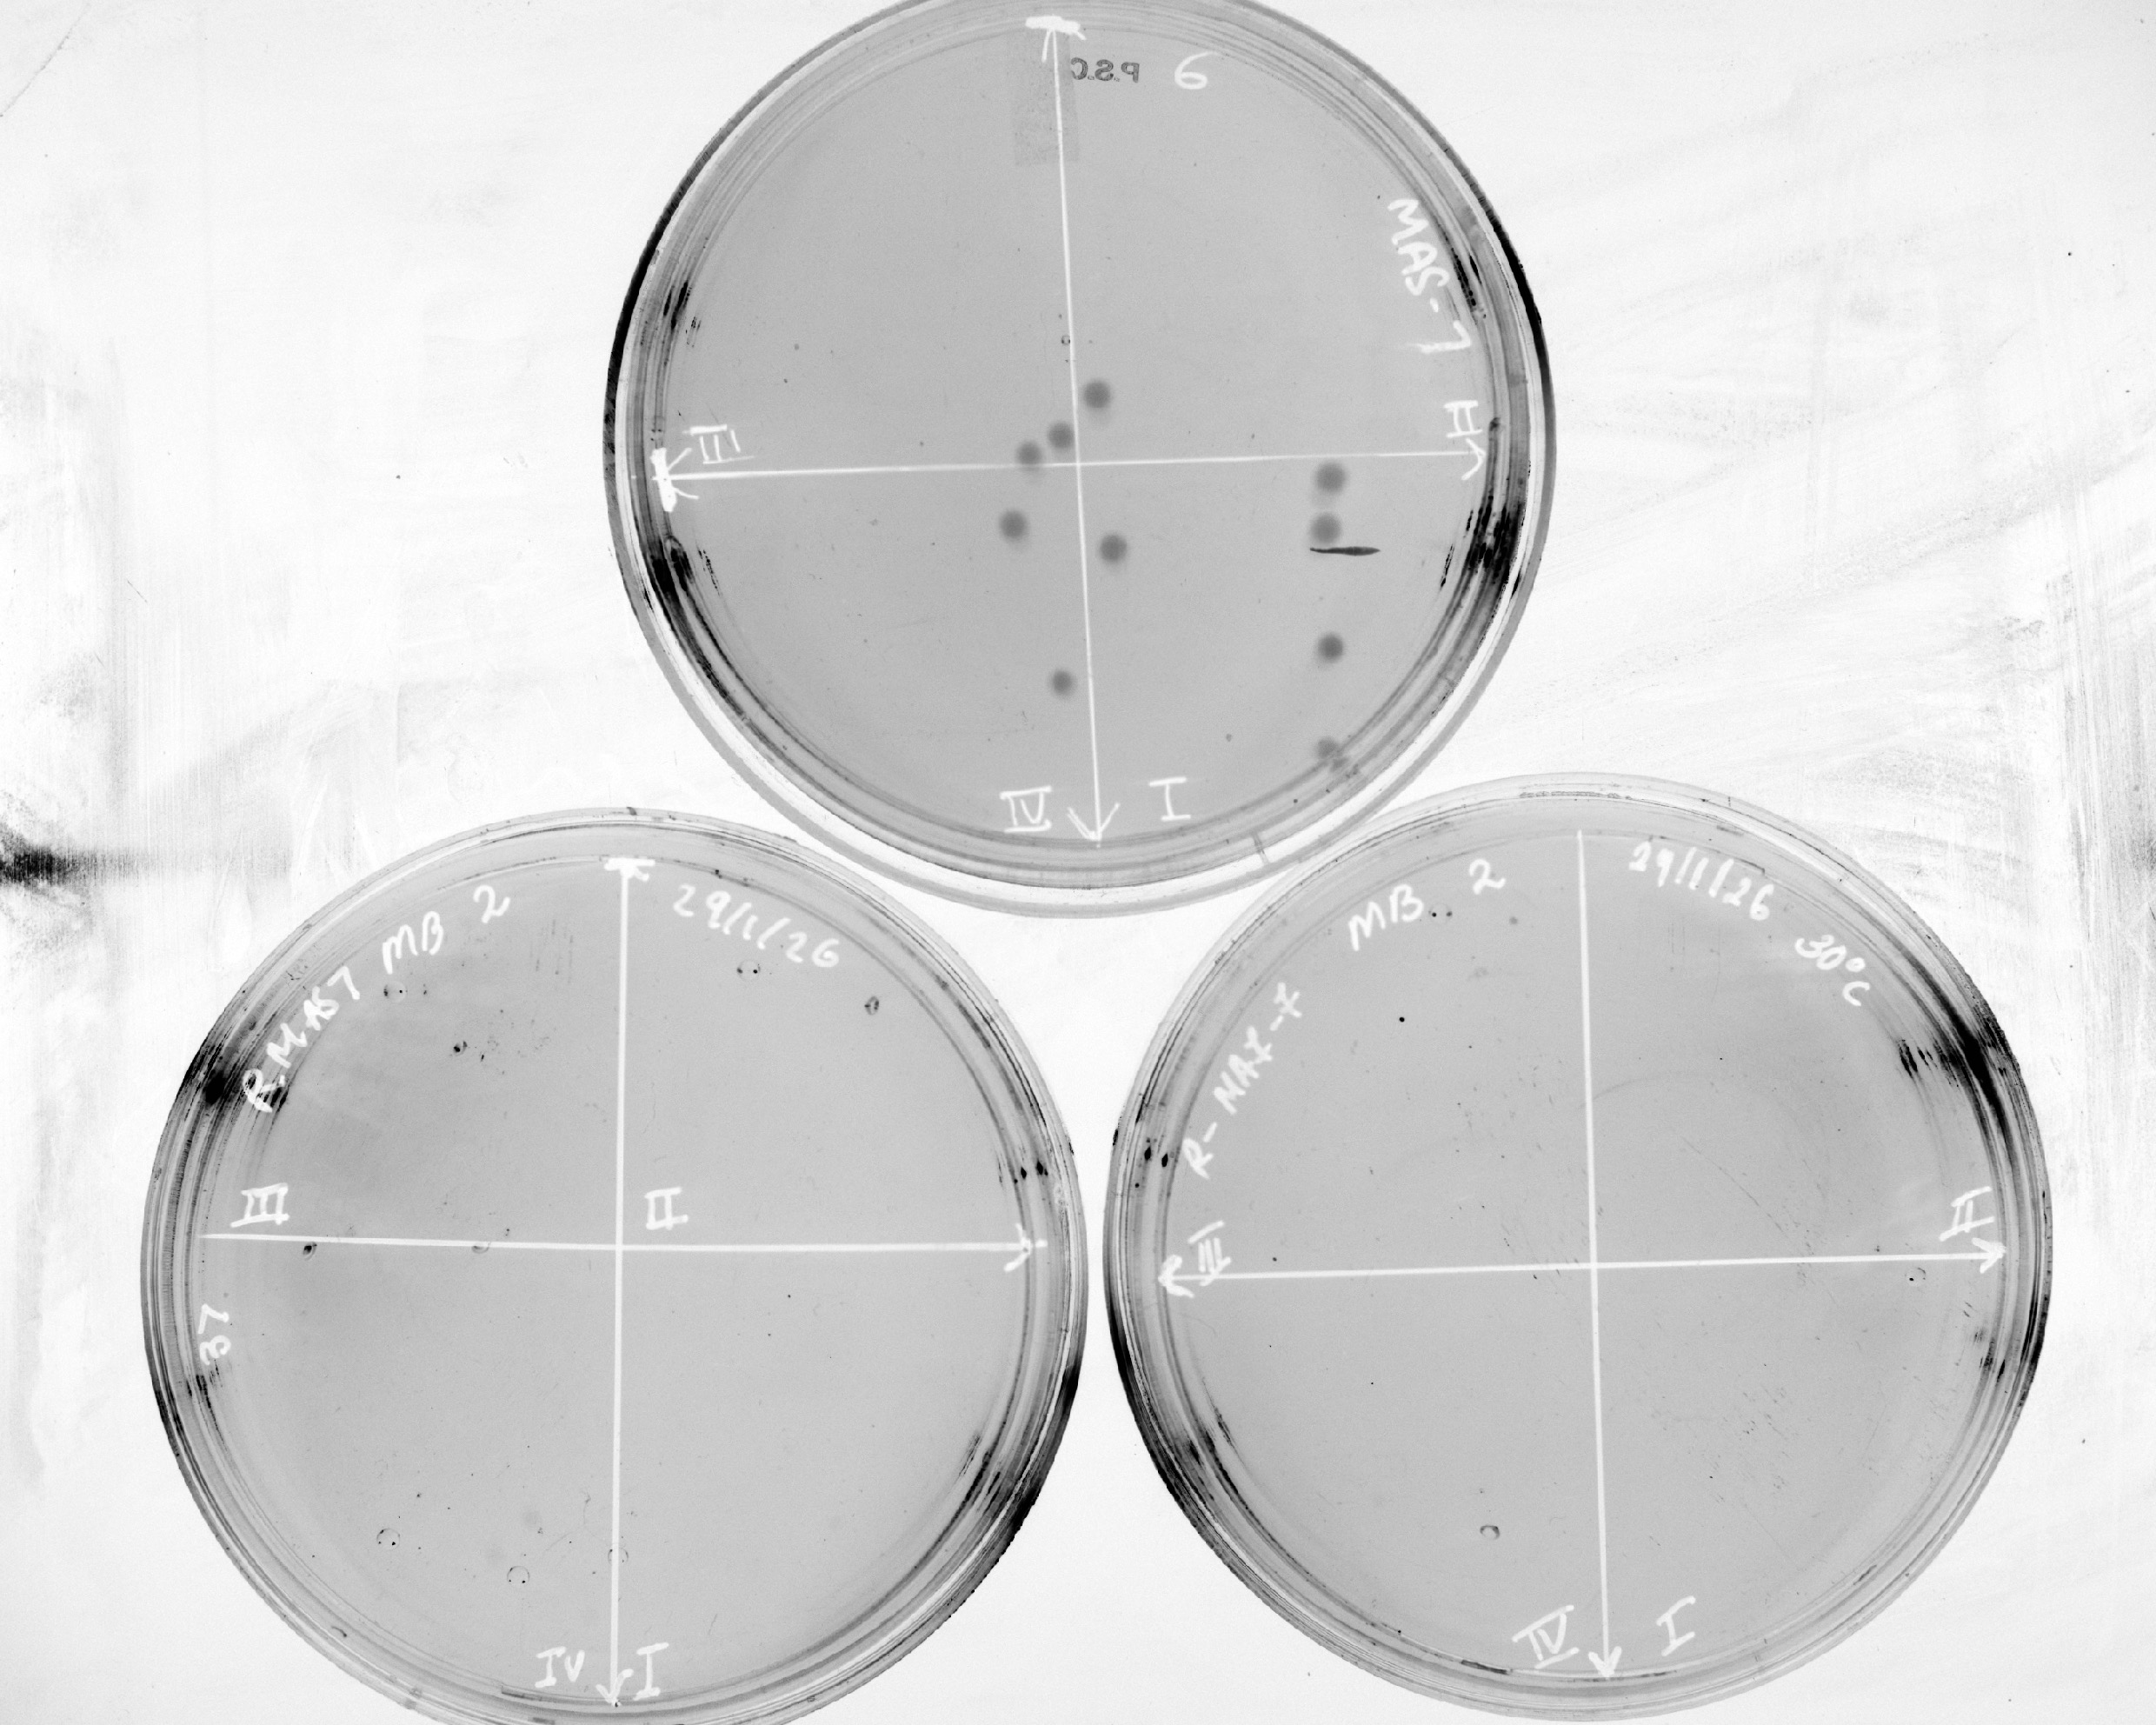
Master plates from the UV screen were imprinted onto sterile velvet stretched tightly over the replica block. Fresh LB-Amp replica plates were oriented and pressed against the velvet. Replicas were grown at permissive (37°C) and restrictive (30°C) temperatures for 16 hours. Colonies exhibiting growth at 37°C but arrested development at 30°C were cataloged as mutant candidates (M1, M2, etc.).
Quantitative Microplate Growth Kinetics
Selected mutants (M4, M5, M6) and four wild-type lines (WT1–WT4) were diluted 1:100 into LB-Amp in 96-well plates (
Spot Dilutions and Motility Assays
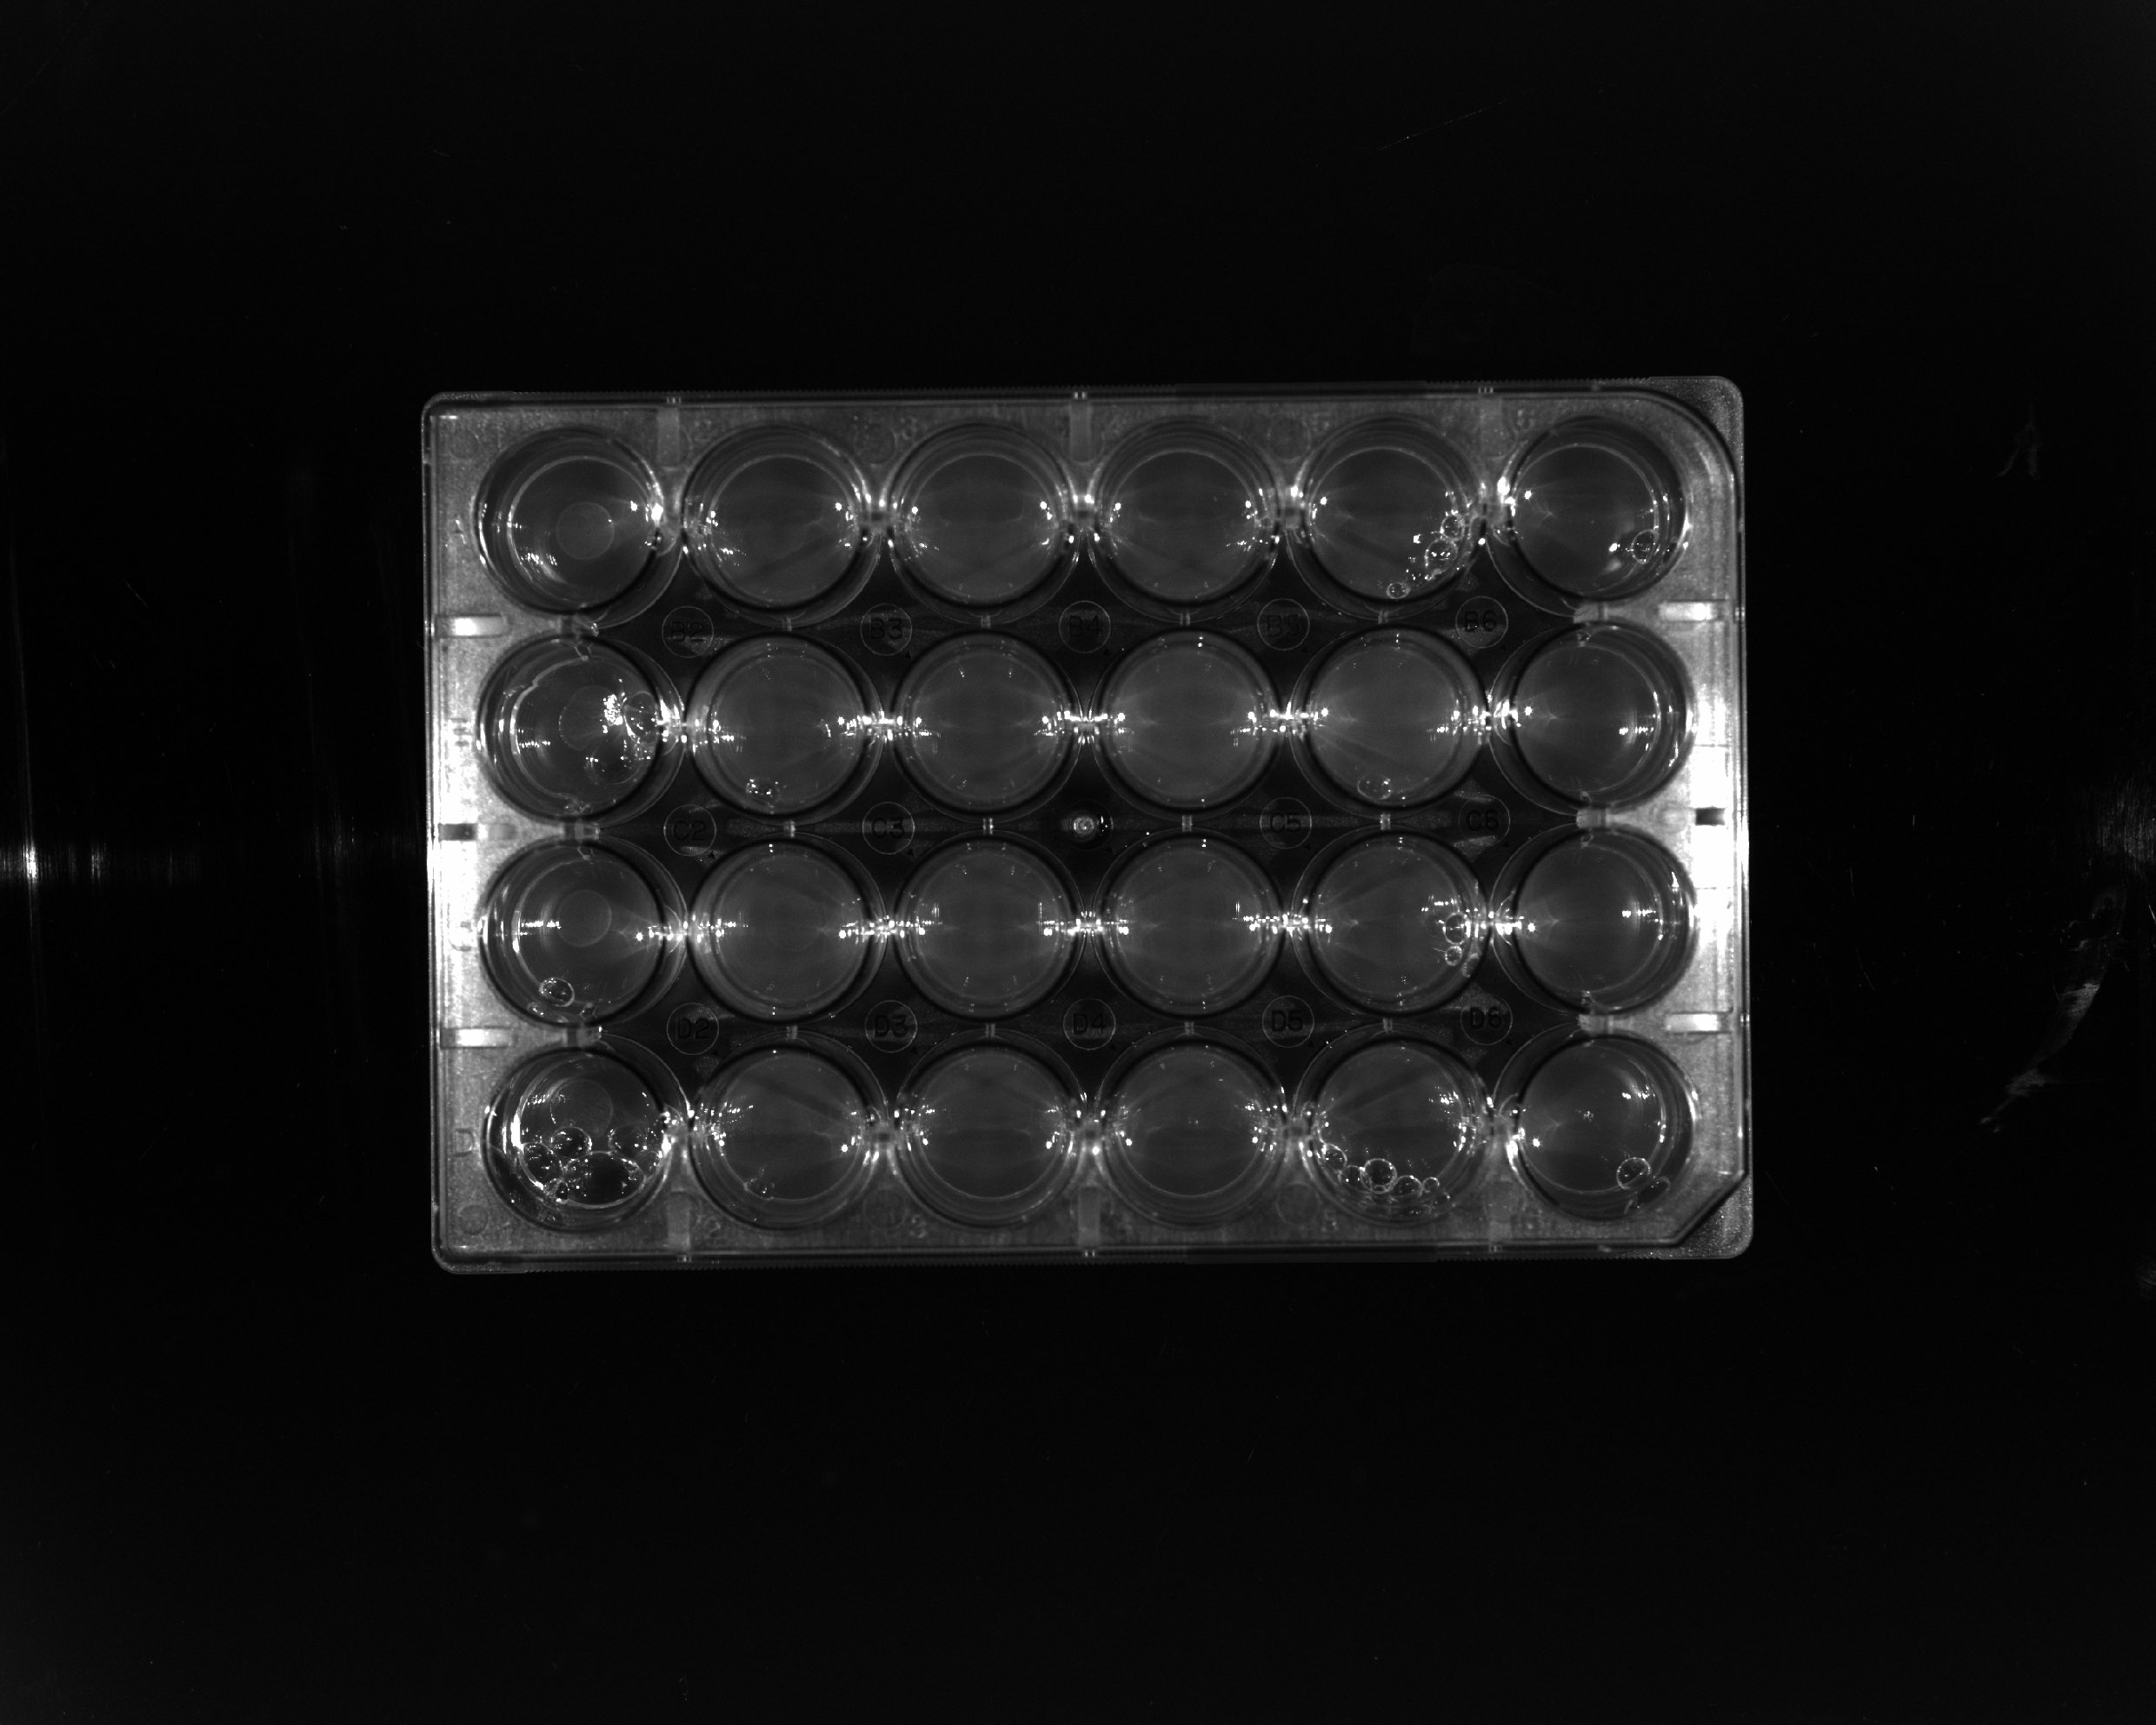
Qualitative viability was assayed by spot-plating 5 µL drops of
Results
Week 1: UV Mutagenesis Survival Kinetics
Survival percentage was calculated relative to the unexposed control:
Batch 2 Colony Plates
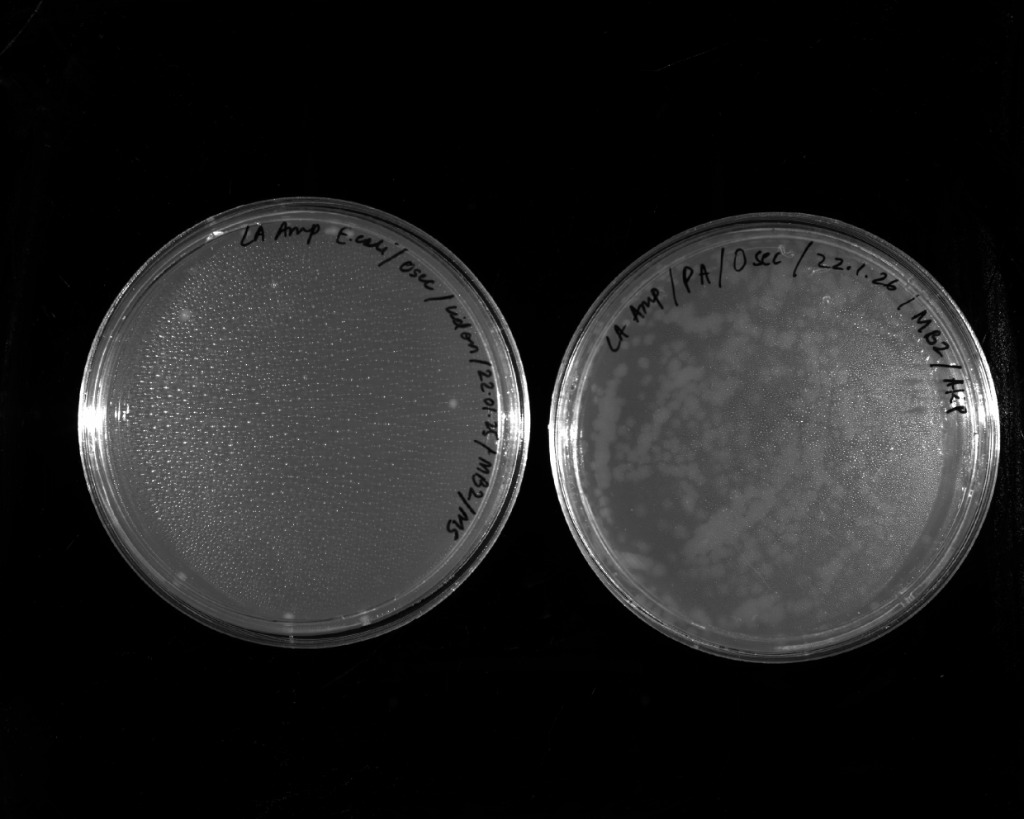 | 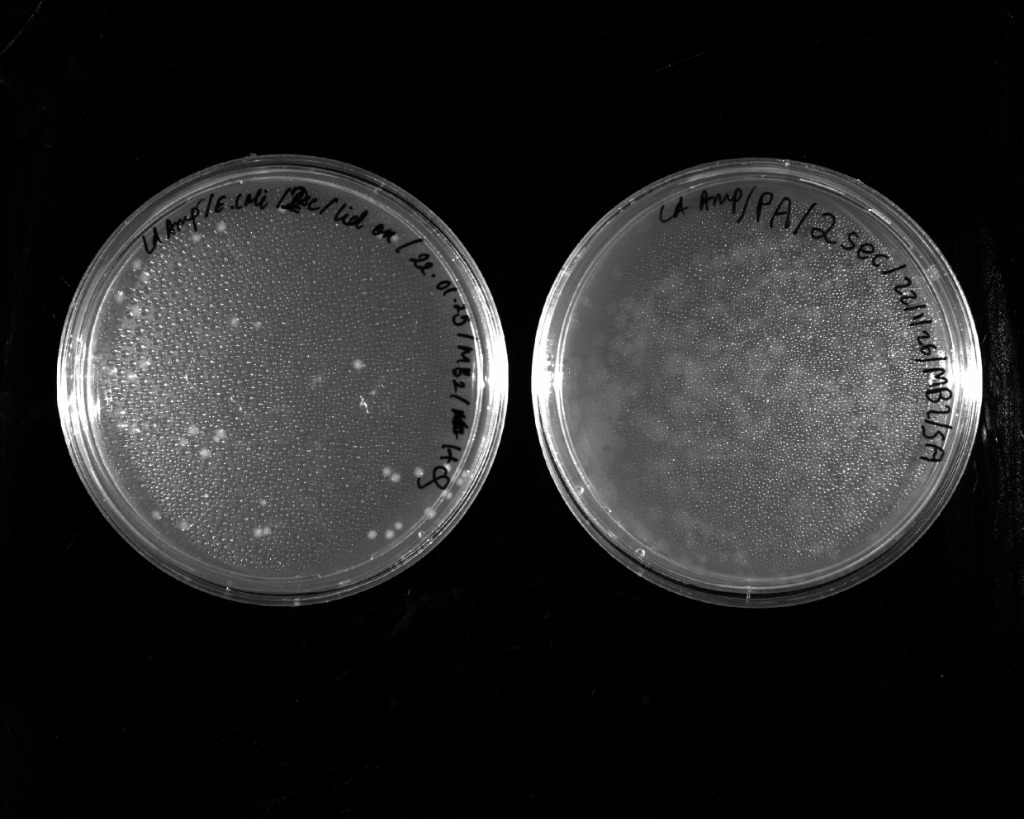 |
|---|---|
| 0 seconds UV exposure | 2 seconds UV exposure |
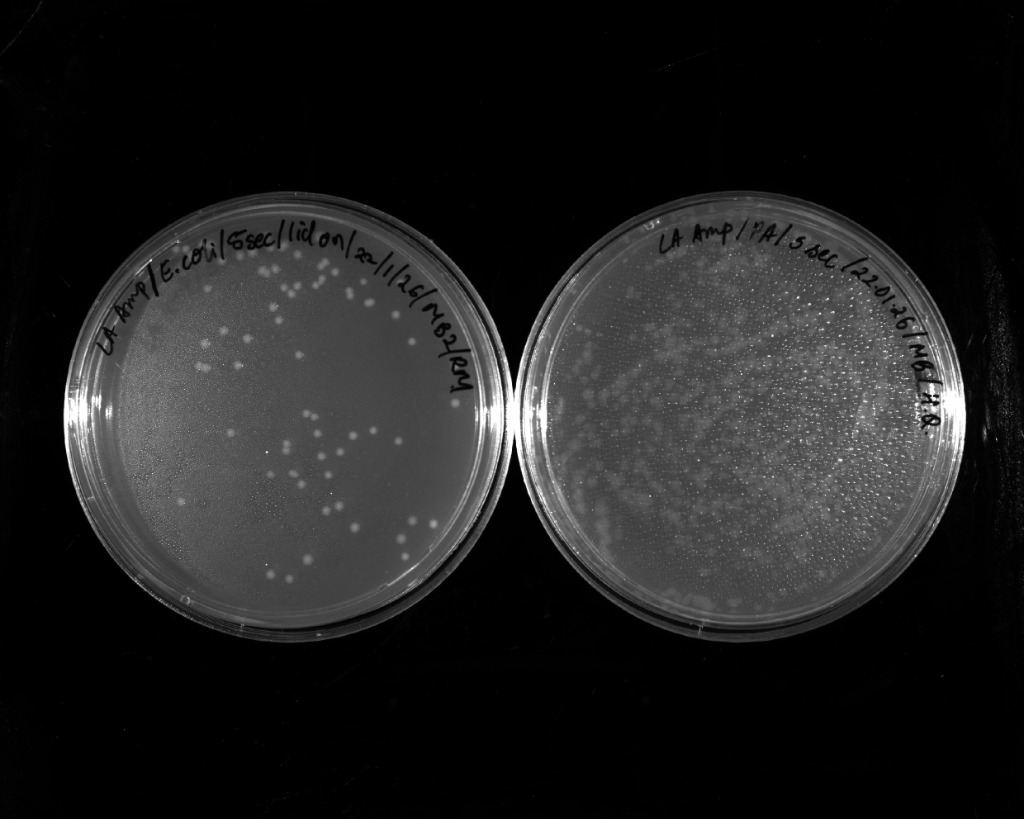 | 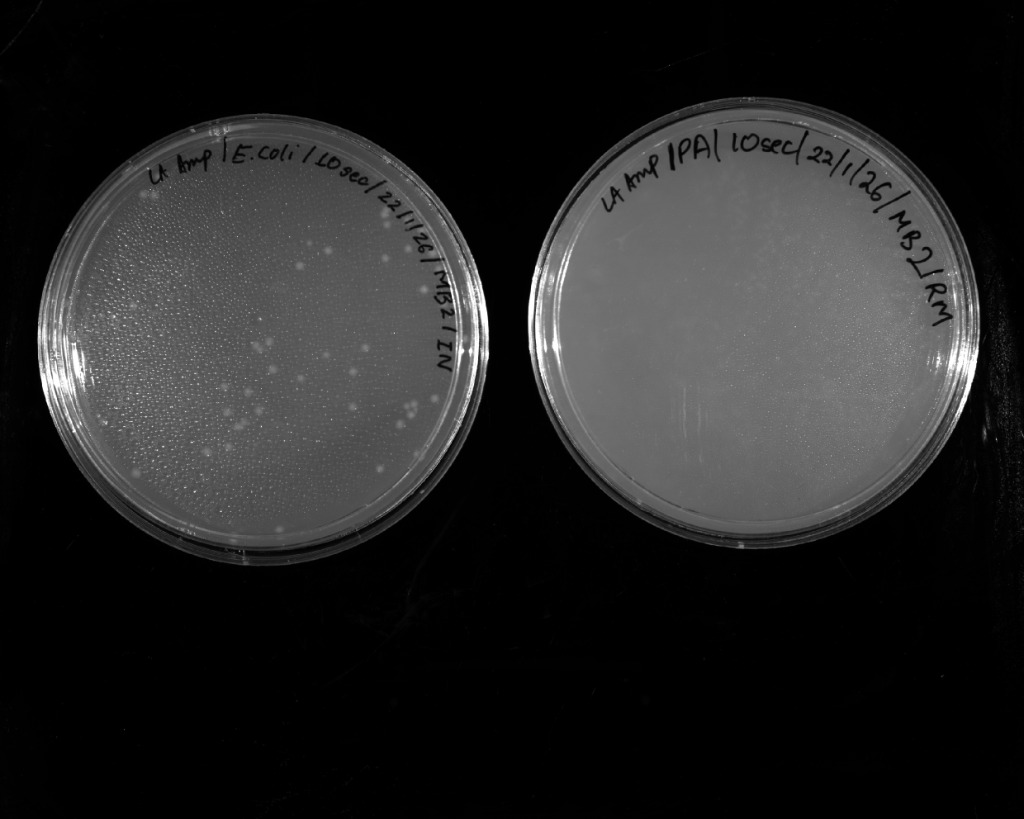 |
| 5 seconds UV exposure | 10 seconds UV exposure |
| Exposure Time (s) | Value 1 | Value 2 | Average Colony Number | Survival (%) |
|---|---|---|---|---|
| 0.00 | 10.00 | 12.00 | 11.00 | 100.00 |
| 2.00 | 36.00 | 34.00 | 35.00 | 318.18 |
| 5.00 | 66.00 | 69.00 | 67.50 | 613.64 |
| 10.00 | 47.00 | 43.00 | 45.00 | 409.09 |
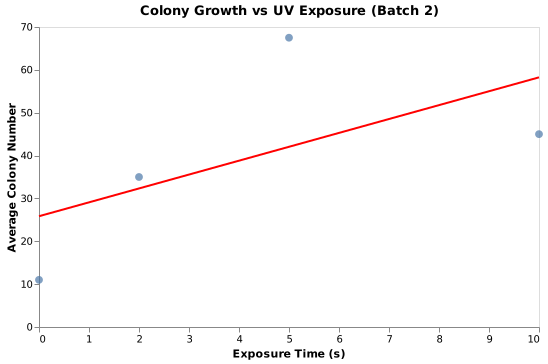
Figure: Batch 2 colony survival response vs. UV exposure.
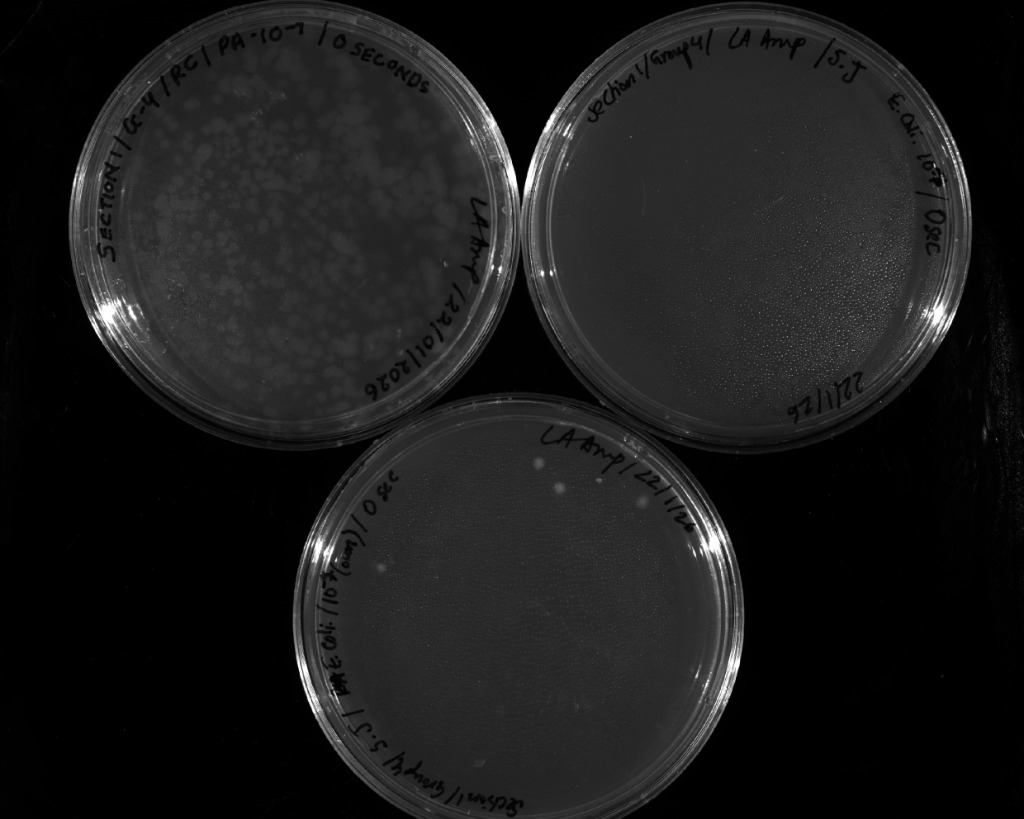
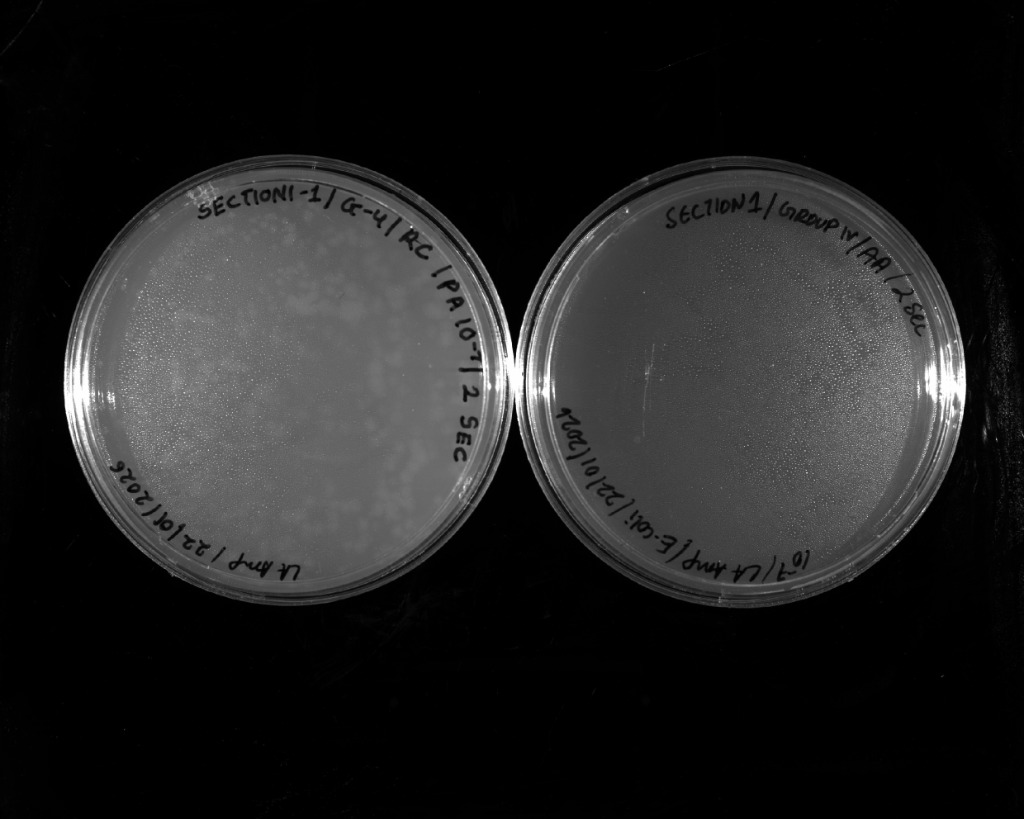
Batch 4 Colony Plates (P. aeruginosa PA14)
 |  |
|---|---|
| 0 seconds UV exposure | 2 seconds UV exposure |
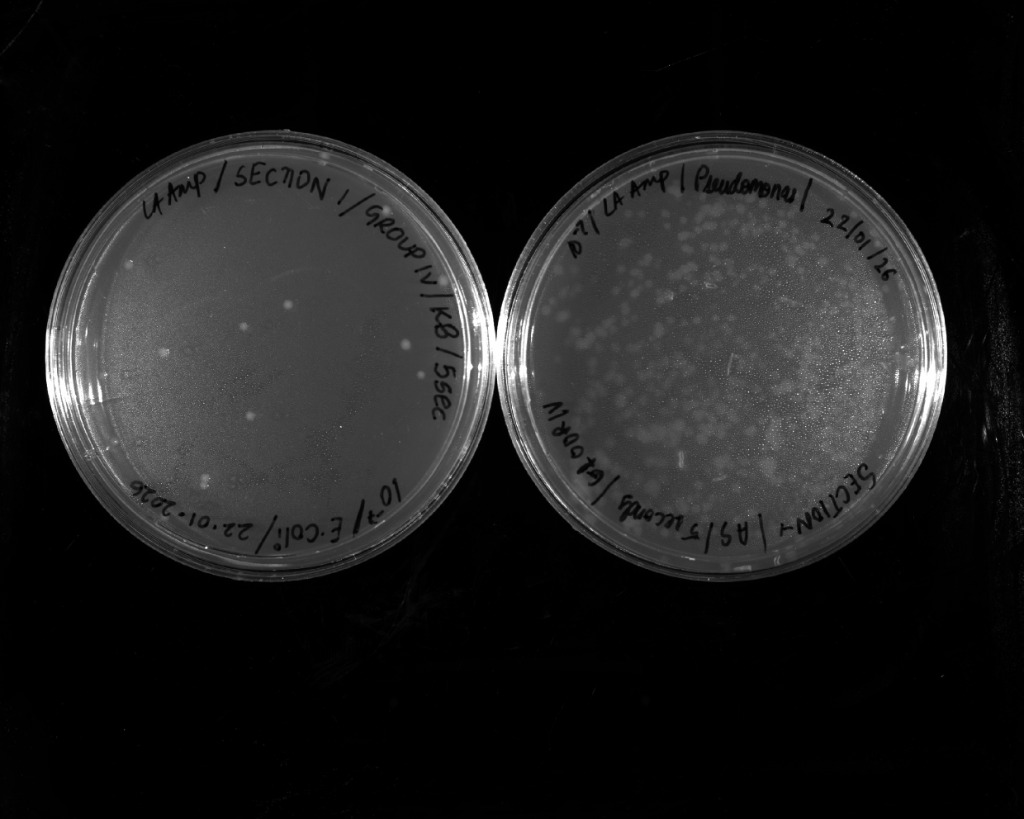 | 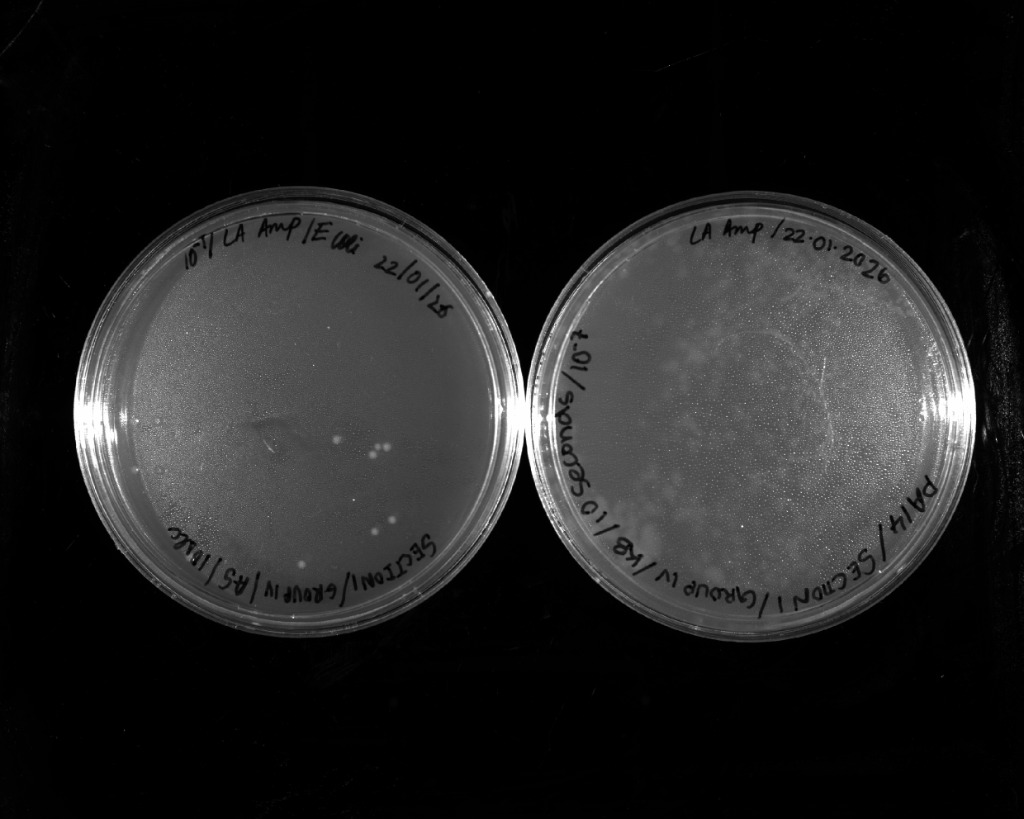 |
| 5 seconds UV exposure | 10 seconds UV exposure |
| Exposure Time (s) | Value A | Value B | Average Colony Number | Survival (%) |
|---|---|---|---|---|
| 0.00 | 290.00 | 290.00 | 290.00 | 100.00 |
| 2.00 | 196.75 | 196.75 | 196.75 | 67.84 |
| 5.00 | 192.00 | 192.00 | 192.00 | 66.21 |
| 10.00 | 124.00 | 124.00 | 124.00 | 42.76 |
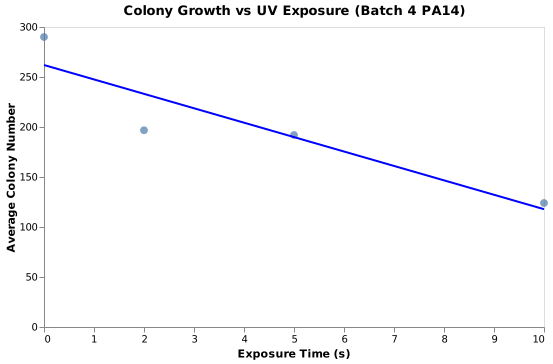
Figure: Batch 4 PA14 UV lethality curve.
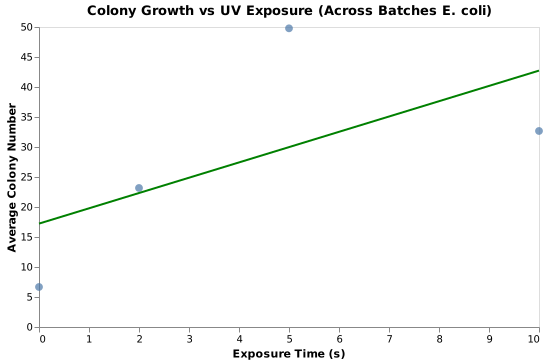
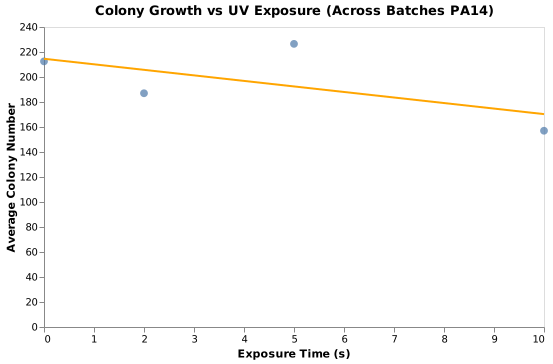
Multi-Batch Combined Response Curves
 |  |
|---|---|
| E. coli multi-batch survival curve | PA14 multi-batch survival curve |
Week 2: Replica Plating Plates
 |  |  |
|---|---|---|
| Master Plate 1 (PA14, 5s) | Master Plate 3 (E. coli, 10s) | Master Plate 7 |
Week 3: Quantitative Growth Kinetics at 30°C vs. 37°C
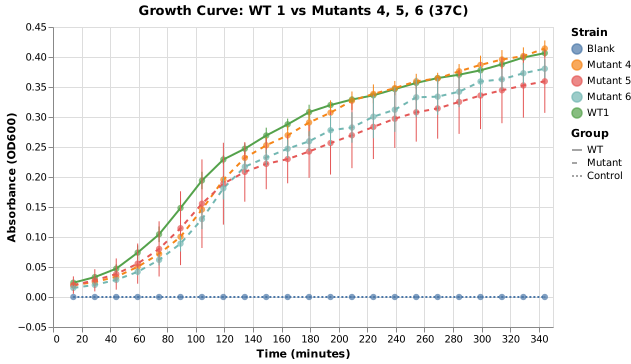
Optical density (
Endpoint Summary at 350 Minutes
37°C Incubation
| Strain | Mean OD600 | Std Dev |
|---|---|---|
| WT1 | 0.41 | 0.01 |
| WT2 | 0.38 | 0.02 |
| WT3 | 0.41 | 0.01 |
| WT4 | 0.39 | 0.04 |
| Mutant 4 | 0.41 | 0.01 |
| Mutant 5 | 0.36 | 0.05 |
| Mutant 6 | 0.38 | 0.02 |
| Blank | 0.00 | 0.00 |
30°C Incubation
| Strain | Mean OD600 | Std Dev |
|---|---|---|
| WT1 | 0.27 | 0.00 |
| WT2 | 0.27 | 0.01 |
| WT3 | 0.26 | 0.02 |
| WT4 | 0.38 | 0.19 |
| Mutant 4 | 0.27 | 0.00 |
| Mutant 5 | 0.26 | 0.01 |
| Mutant 6 | 0.28 | 0.01 |
| Blank | 0.00 | 0.00 |
Comparative Kinetic Growth Curves
 | 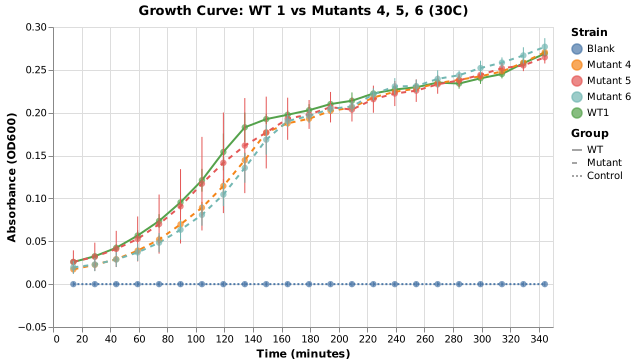 |
|---|---|
| WT1 vs Mutants at 37°C | WT1 vs Mutants at 30°C |
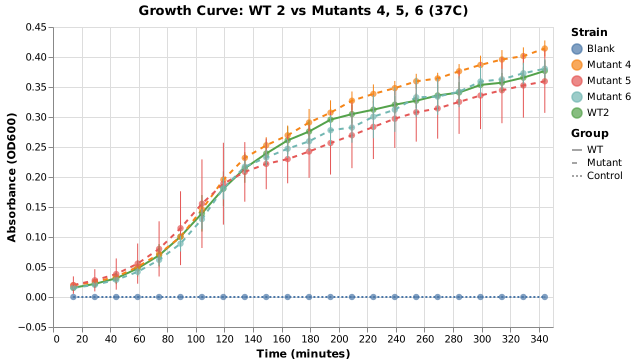 | 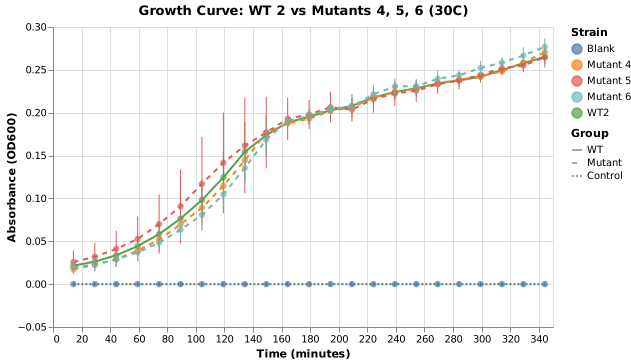 |
| WT2 vs Mutants at 37°C | WT2 vs Mutants at 30°C |
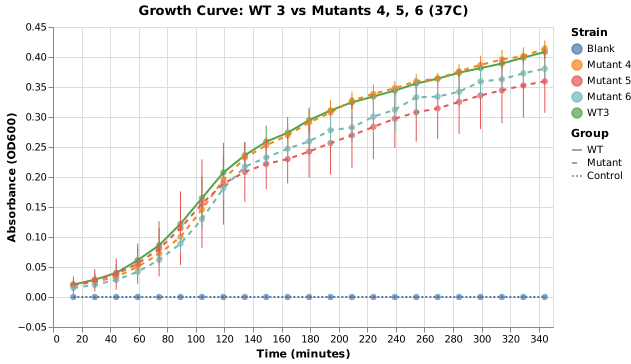 | 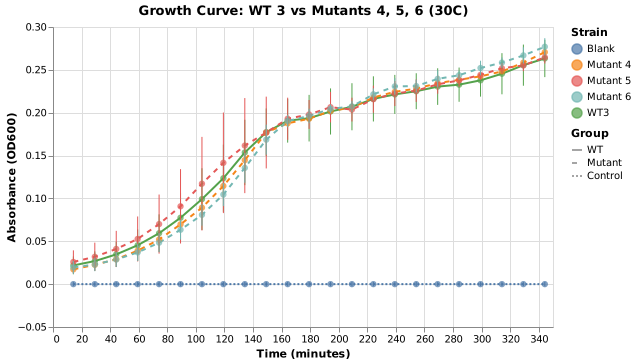 |
| WT3 vs Mutants at 37°C | WT3 vs Mutants at 30°C |
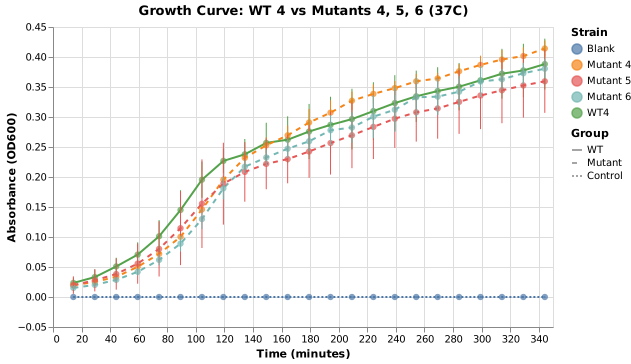 | 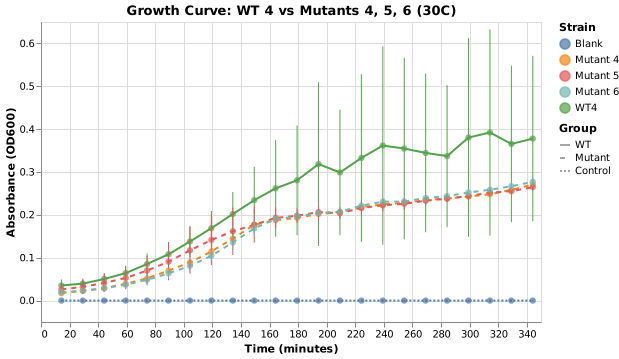 |
| WT4 vs Mutants at 37°C | WT4 vs Mutants at 30°C |
Week 4: Qualitative Spot Dilutions and Motility Assays
 | 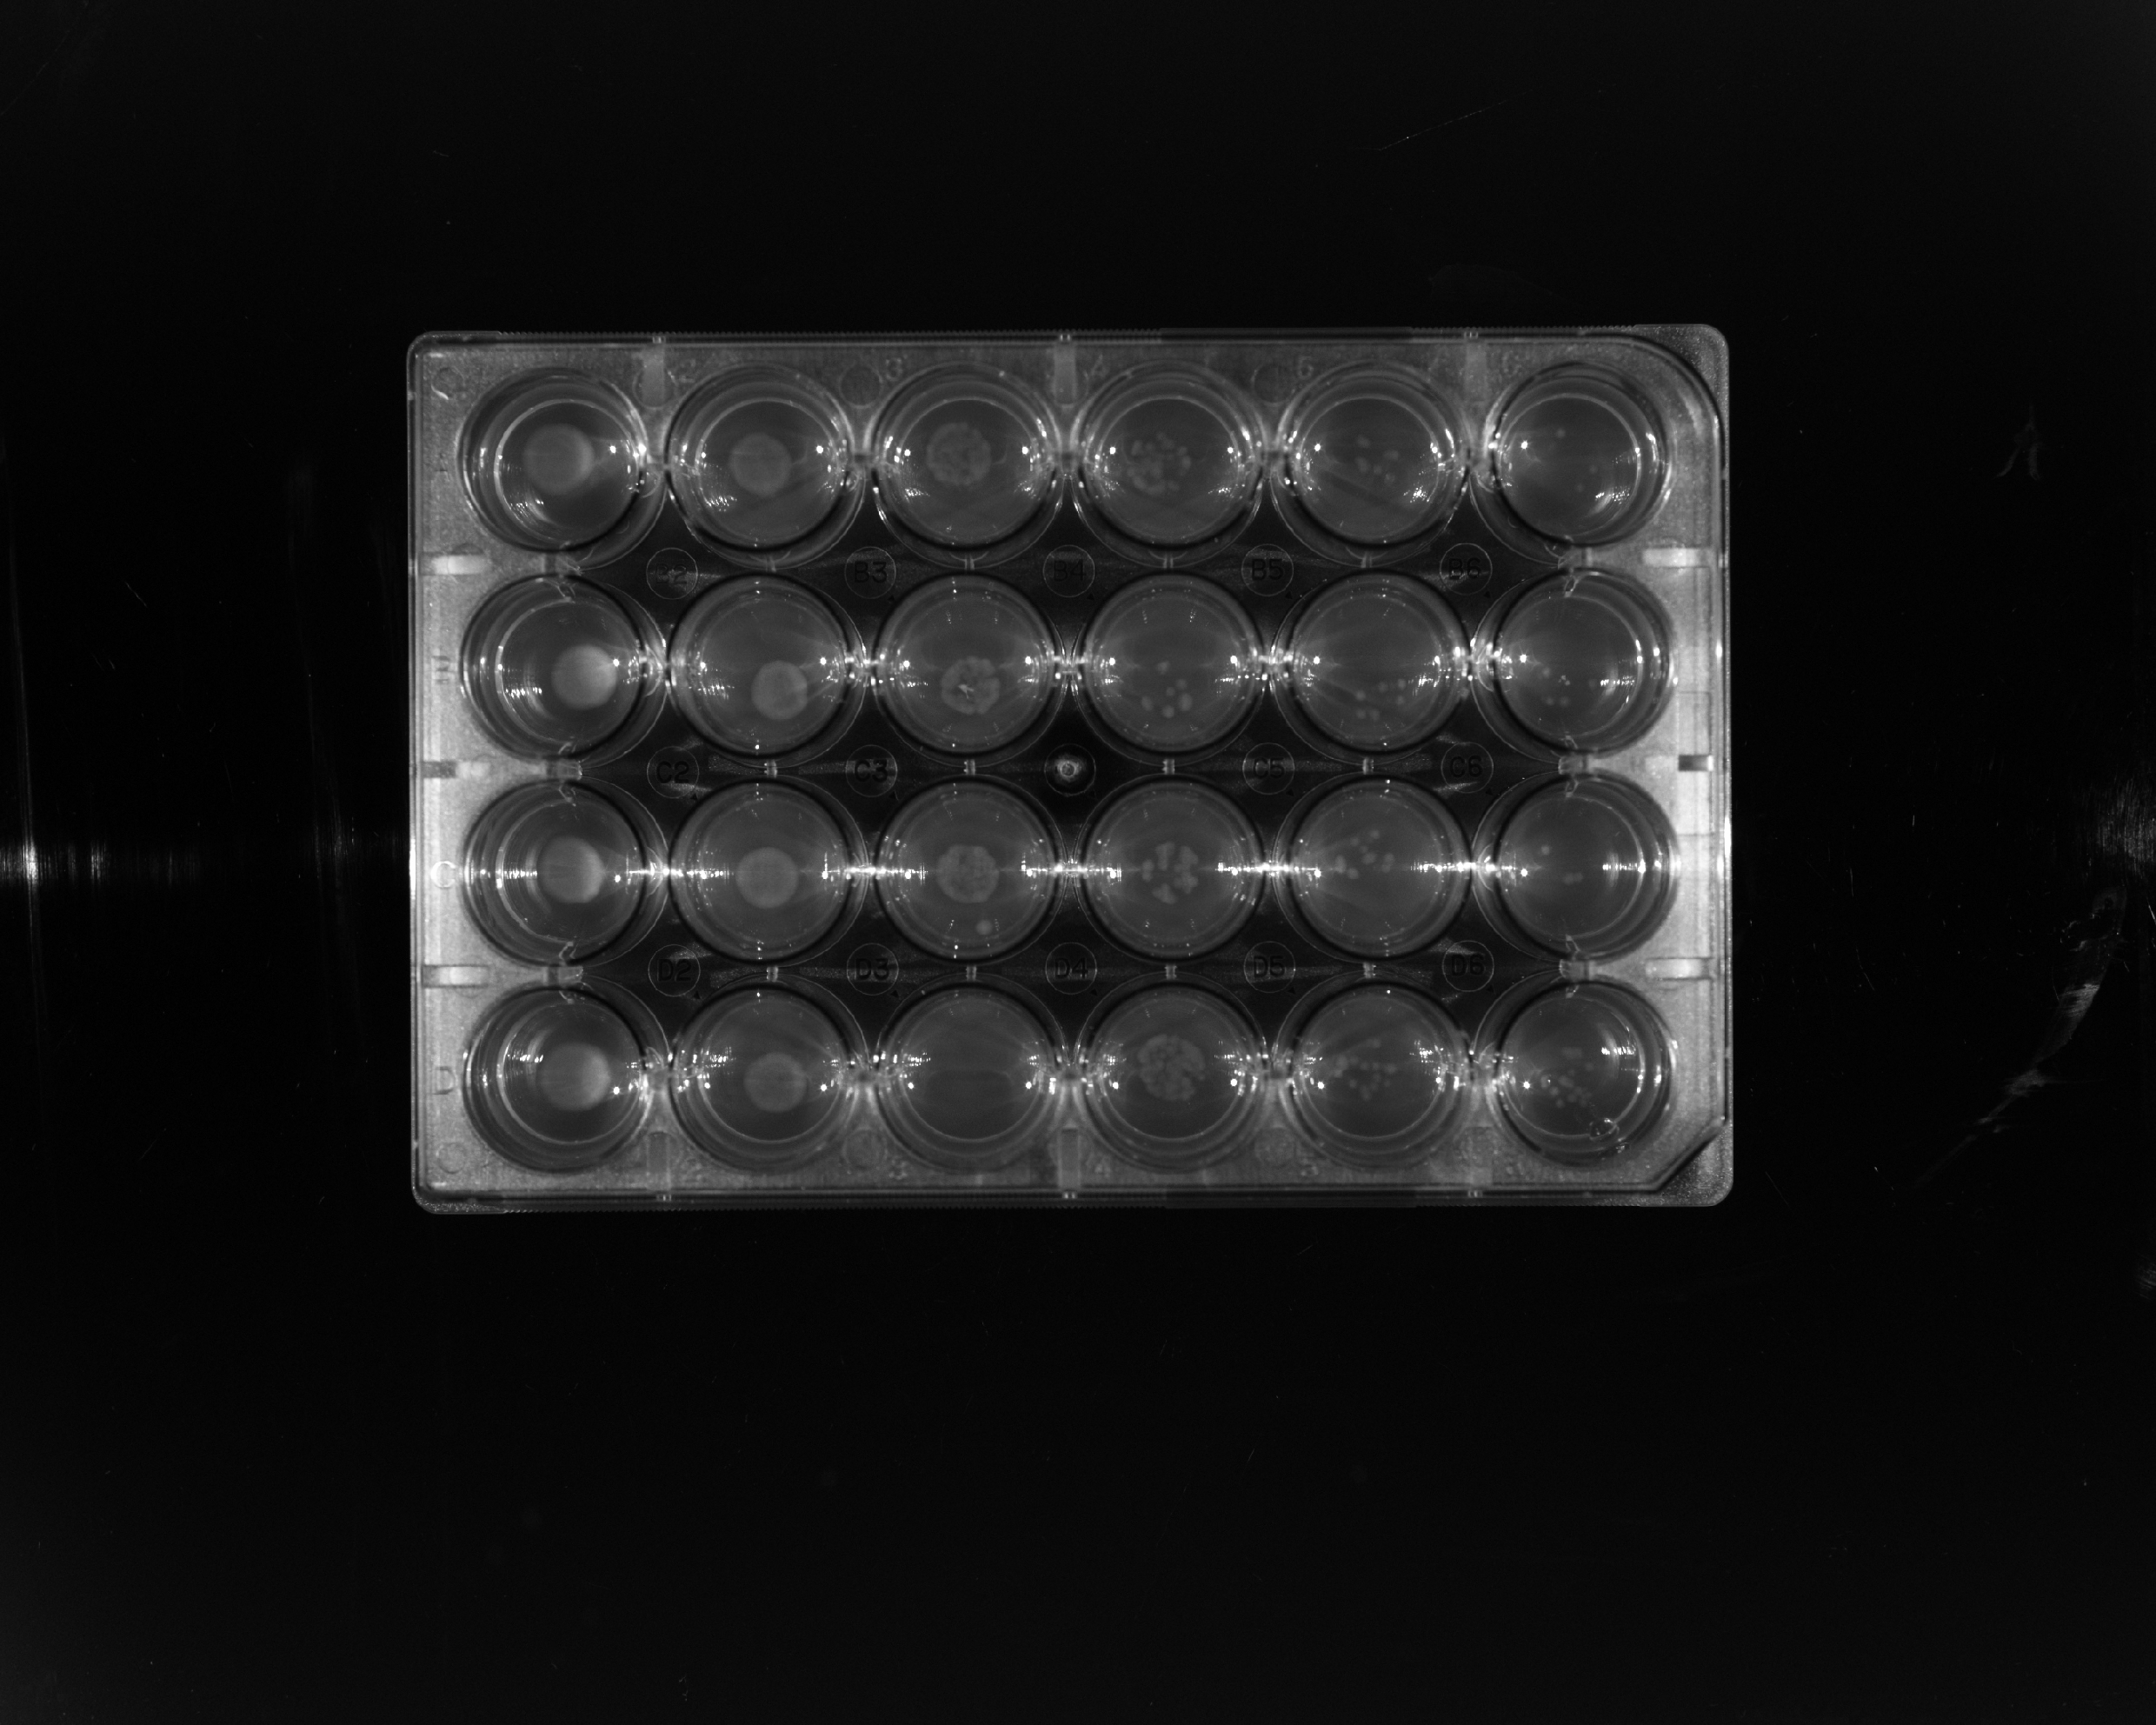 |
|---|---|
| Spot Dilution Assay at 30°C | Spot Dilution Assay at 37°C |
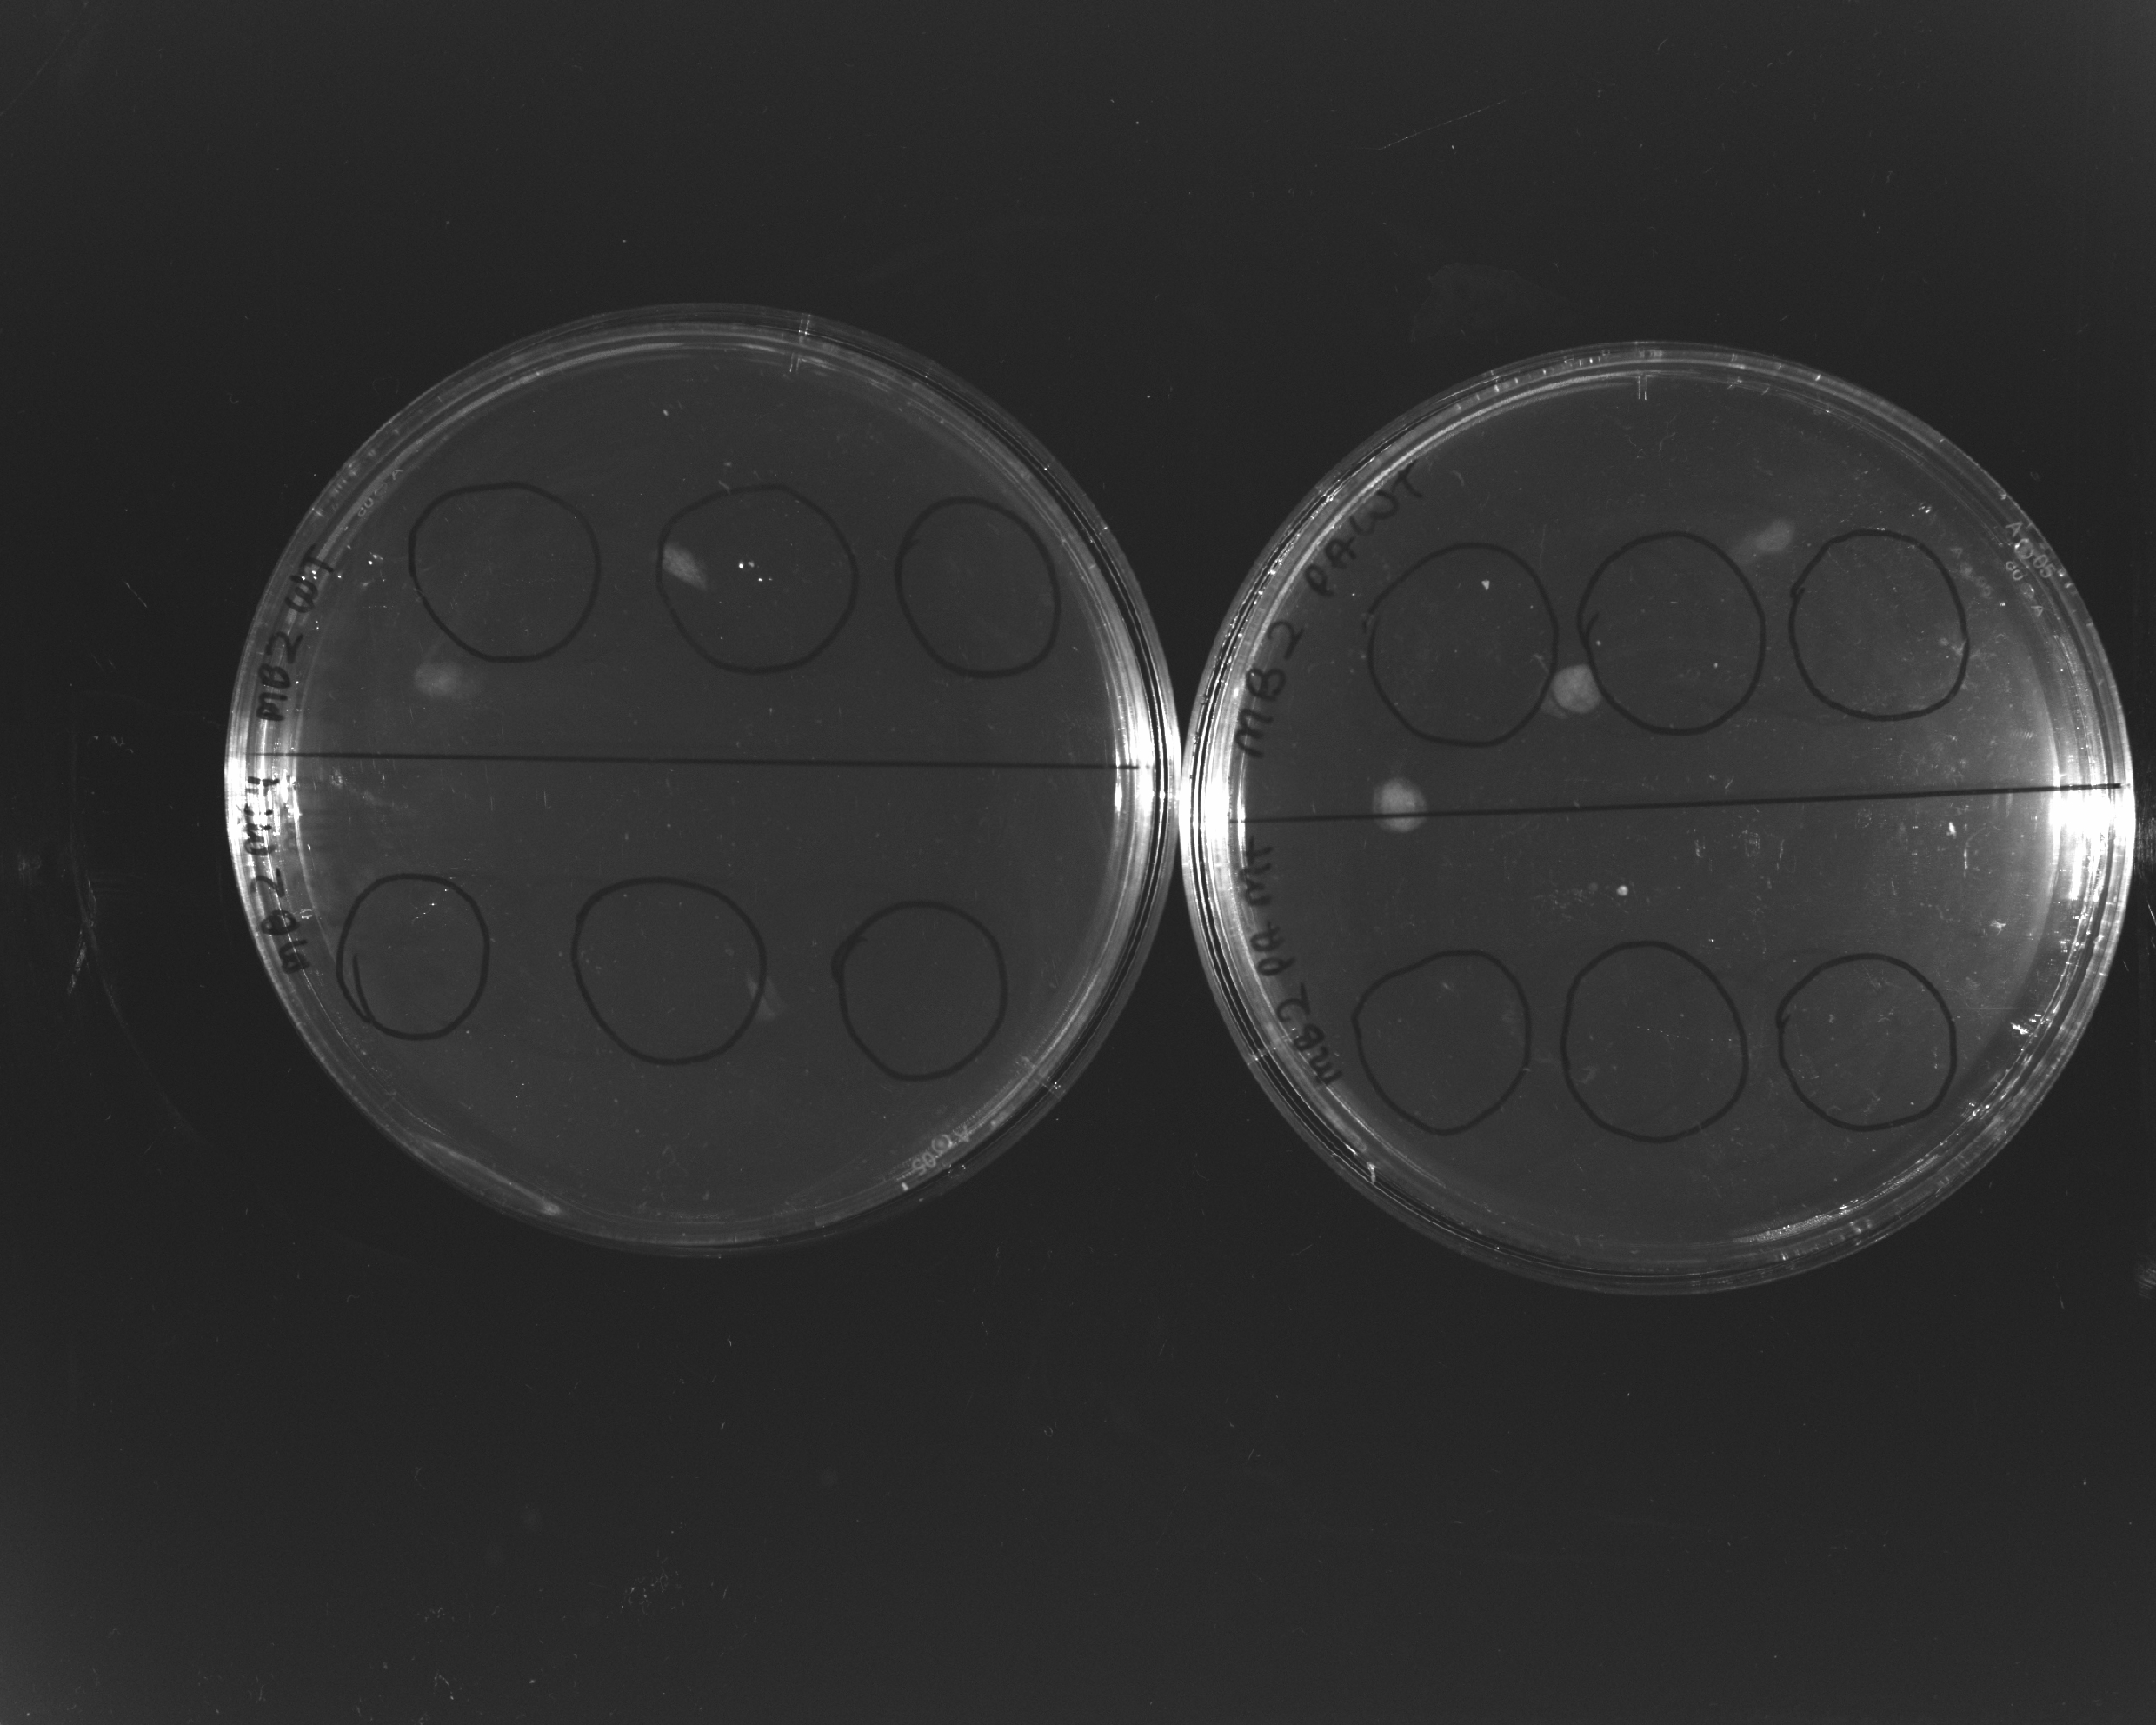 | 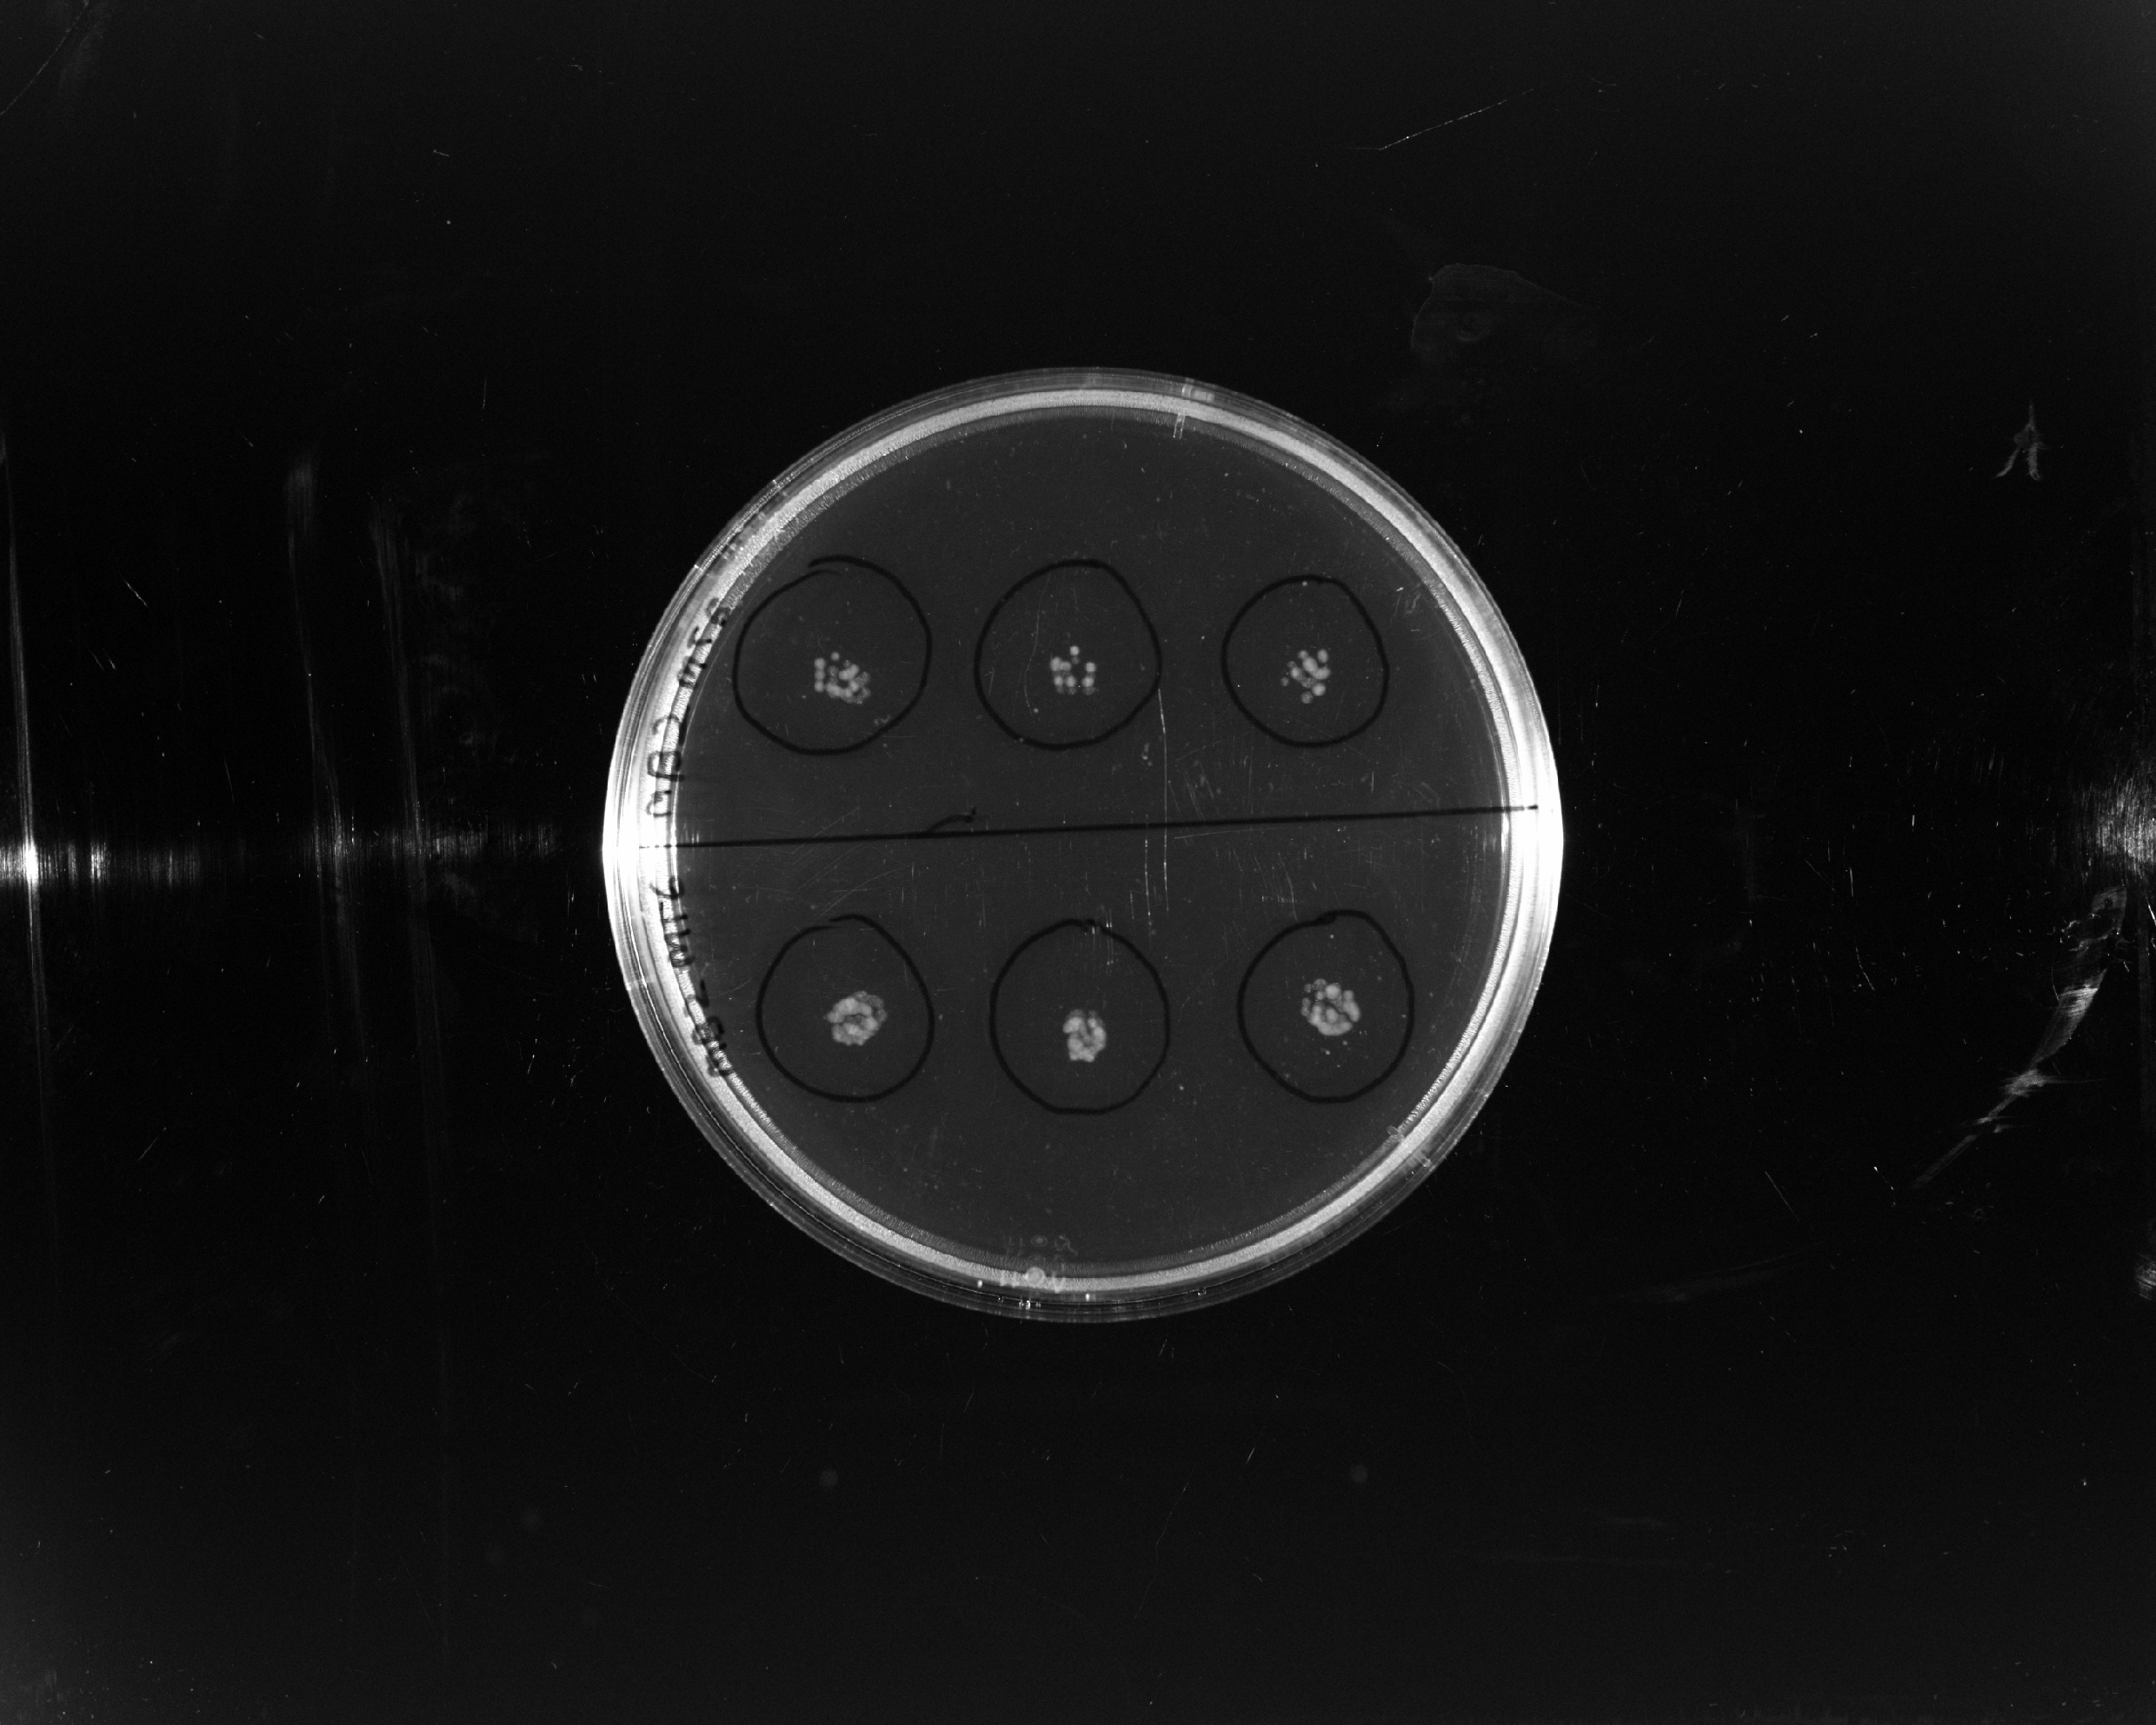 |
| Motility: Mutant 4, PA14, E. coli WT | Motility: Mutants 5 and 6 |
Discussion
Mutagenesis Lethality Dynamics
For P. aeruginosa PA14, survival decreased monotonically with UV exposure duration (100% at 0s down to 42.8% at 10s), consistent with standard pyrimidine dimer accumulation kinetics. In E. coli Batch 2, an anomalous increase in colony counts at 2s and 5s indicated pre-plating serial dilution variance or incomplete spreading before irradiation.
Growth Kinetics Discrepancies
Spectrophotometric growth profiles revealed marked temperature dependence: all strains reached significantly higher terminal cell density at 37°C (
References
- Miller, J.H. (1992). A Short Course in Bacterial Genetics: A Laboratory Manual and Handbook for Escherichia coli and Related Bacteria. Cold Spring Harbor Laboratory Press.
- Rahme, L.G. et al. (1995). Common virulence factors for bacterial pathogenicity in plants and animals. Science, 268(5219), pp. 1899–1902.