Patterns of Morphological Variation: Geometric Morphometrics
Introduction
Organisms from the same species often exhibit marked morphological variation arising from differences in genetic background, developmental plasticity, and environmental constraints. To quantify anatomical shifts, biological researchers employ morphometrics: either traditional linear morphometrics (comparing distance metrics such as body length or width) or multidimensional landmark-based geometric morphometrics, which separates pure shape deformation from uniform isotropic scaling.
In this investigation, we evaluated morphological differentiation in Drosophila melanogaster reared under chronic nutritional stress (malnutrition) versus control diets, assessing whether landmark-based geometric morphometrics provides superior discriminative resolution compared to traditional linear metrics.
Materials and Methods
Materials
- Female D. melanogaster from control (C) and selected malnourished (S) lineages
- Left wings mounted on glass microscope slides
- Stereomicroscope coupled to high-resolution digital imaging apparatus
- ImageJ (linear trait calibration and coordinate extraction)
- MorphoJ (Generalized Procrustes Analysis and Principal Component Analysis)
Methods
Traditional Linear Morphometrics
Head width and thorax length were measured on calibrated stereomicrographs (C01–C06 and S01–S06) to capture macro-level somatic size variation.
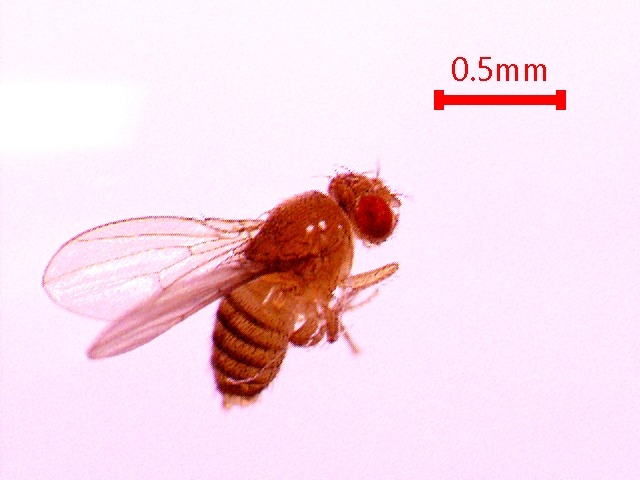 | 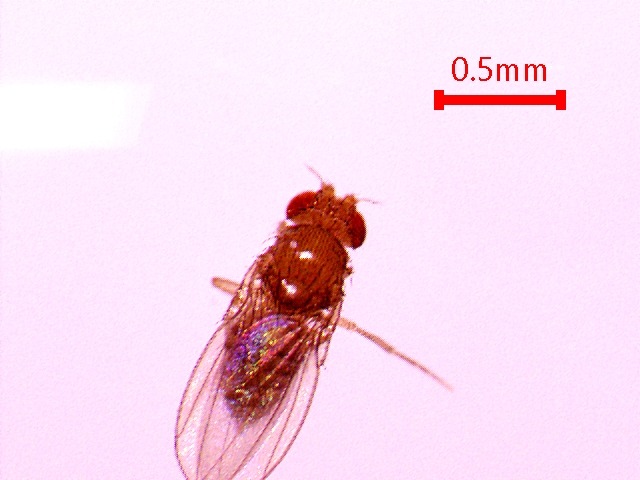 |
|---|---|
| Control female specimen (0.5 mm scale bar) | Selected malnourished female specimen (0.5 mm scale bar) |
Geometric Morphometrics Protocol
Left wings from 24 female specimens (12 control: C01L–C12L; 12 malnourished: S01L–S12L) were dissected, mounted flat, and imaged under uniform magnification.
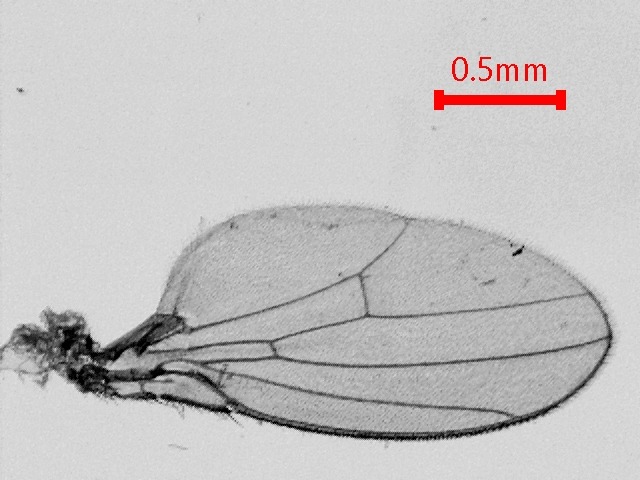 | 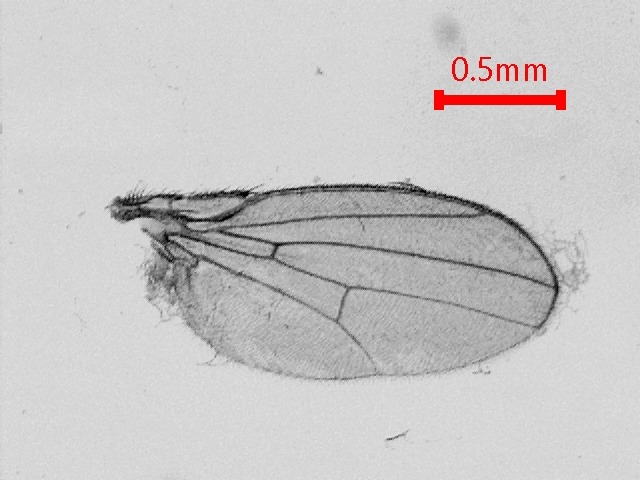 |
|---|---|
| Mounted left wing from control line | Mounted left wing from malnourished line |
Eleven homologous anatomical landmarks were digitized at standardized vein junctions and wing margins across all specimens:
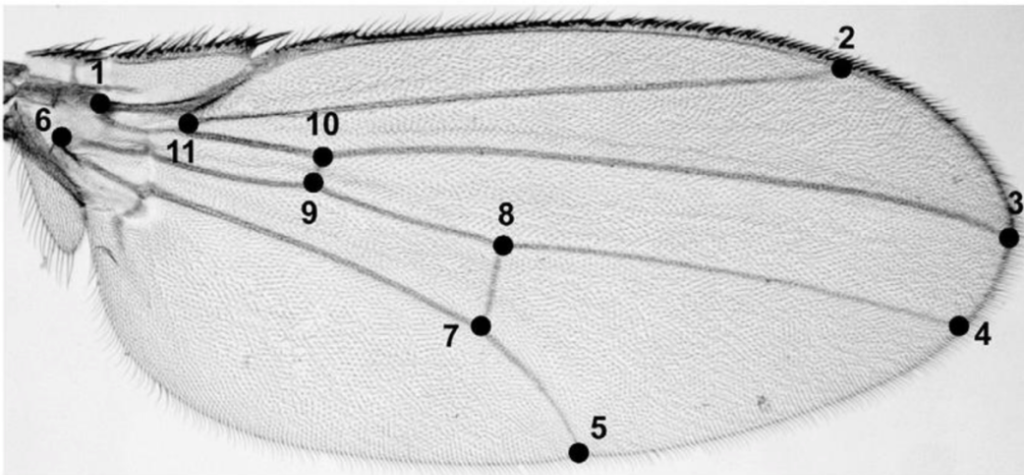
Figure: Configuration of the 11 digitized anatomical landmarks on the Drosophila wing blade.
Procrustes Alignment & Principal Component Analysis (PCA)
Raw coordinates were translated, scaled to unit centroid size, and iteratively rotated via Generalized Procrustes Analysis (GPA) to isolate pure shape variation. PCA was executed on the Procrustes covariance matrix in MorphoJ to identify orthogonal axes of coordinated morphological variance.
Results and Discussion
Traditional Linear Morphometrics
Summary statistics for thorax length and head width (
| Measurement | Treatment Group | Min | Q1 | Median | Q3 | Max |
|---|---|---|---|---|---|---|
| Thorax Length (mm) | Control | 0.3320 | 0.3788 | 0.3920 | 0.4390 | 0.4620 |
| Selected (Malnourished) | 0.3050 | 0.3348 | 0.3735 | 0.4010 | 0.4330 | |
| Head Width (mm) | Control | 0.3000 | 0.3333 | 0.3460 | 0.3663 | 0.3940 |
| Selected (Malnourished) | 0.2790 | 0.2830 | 0.2985 | 0.3163 | 0.3200 |
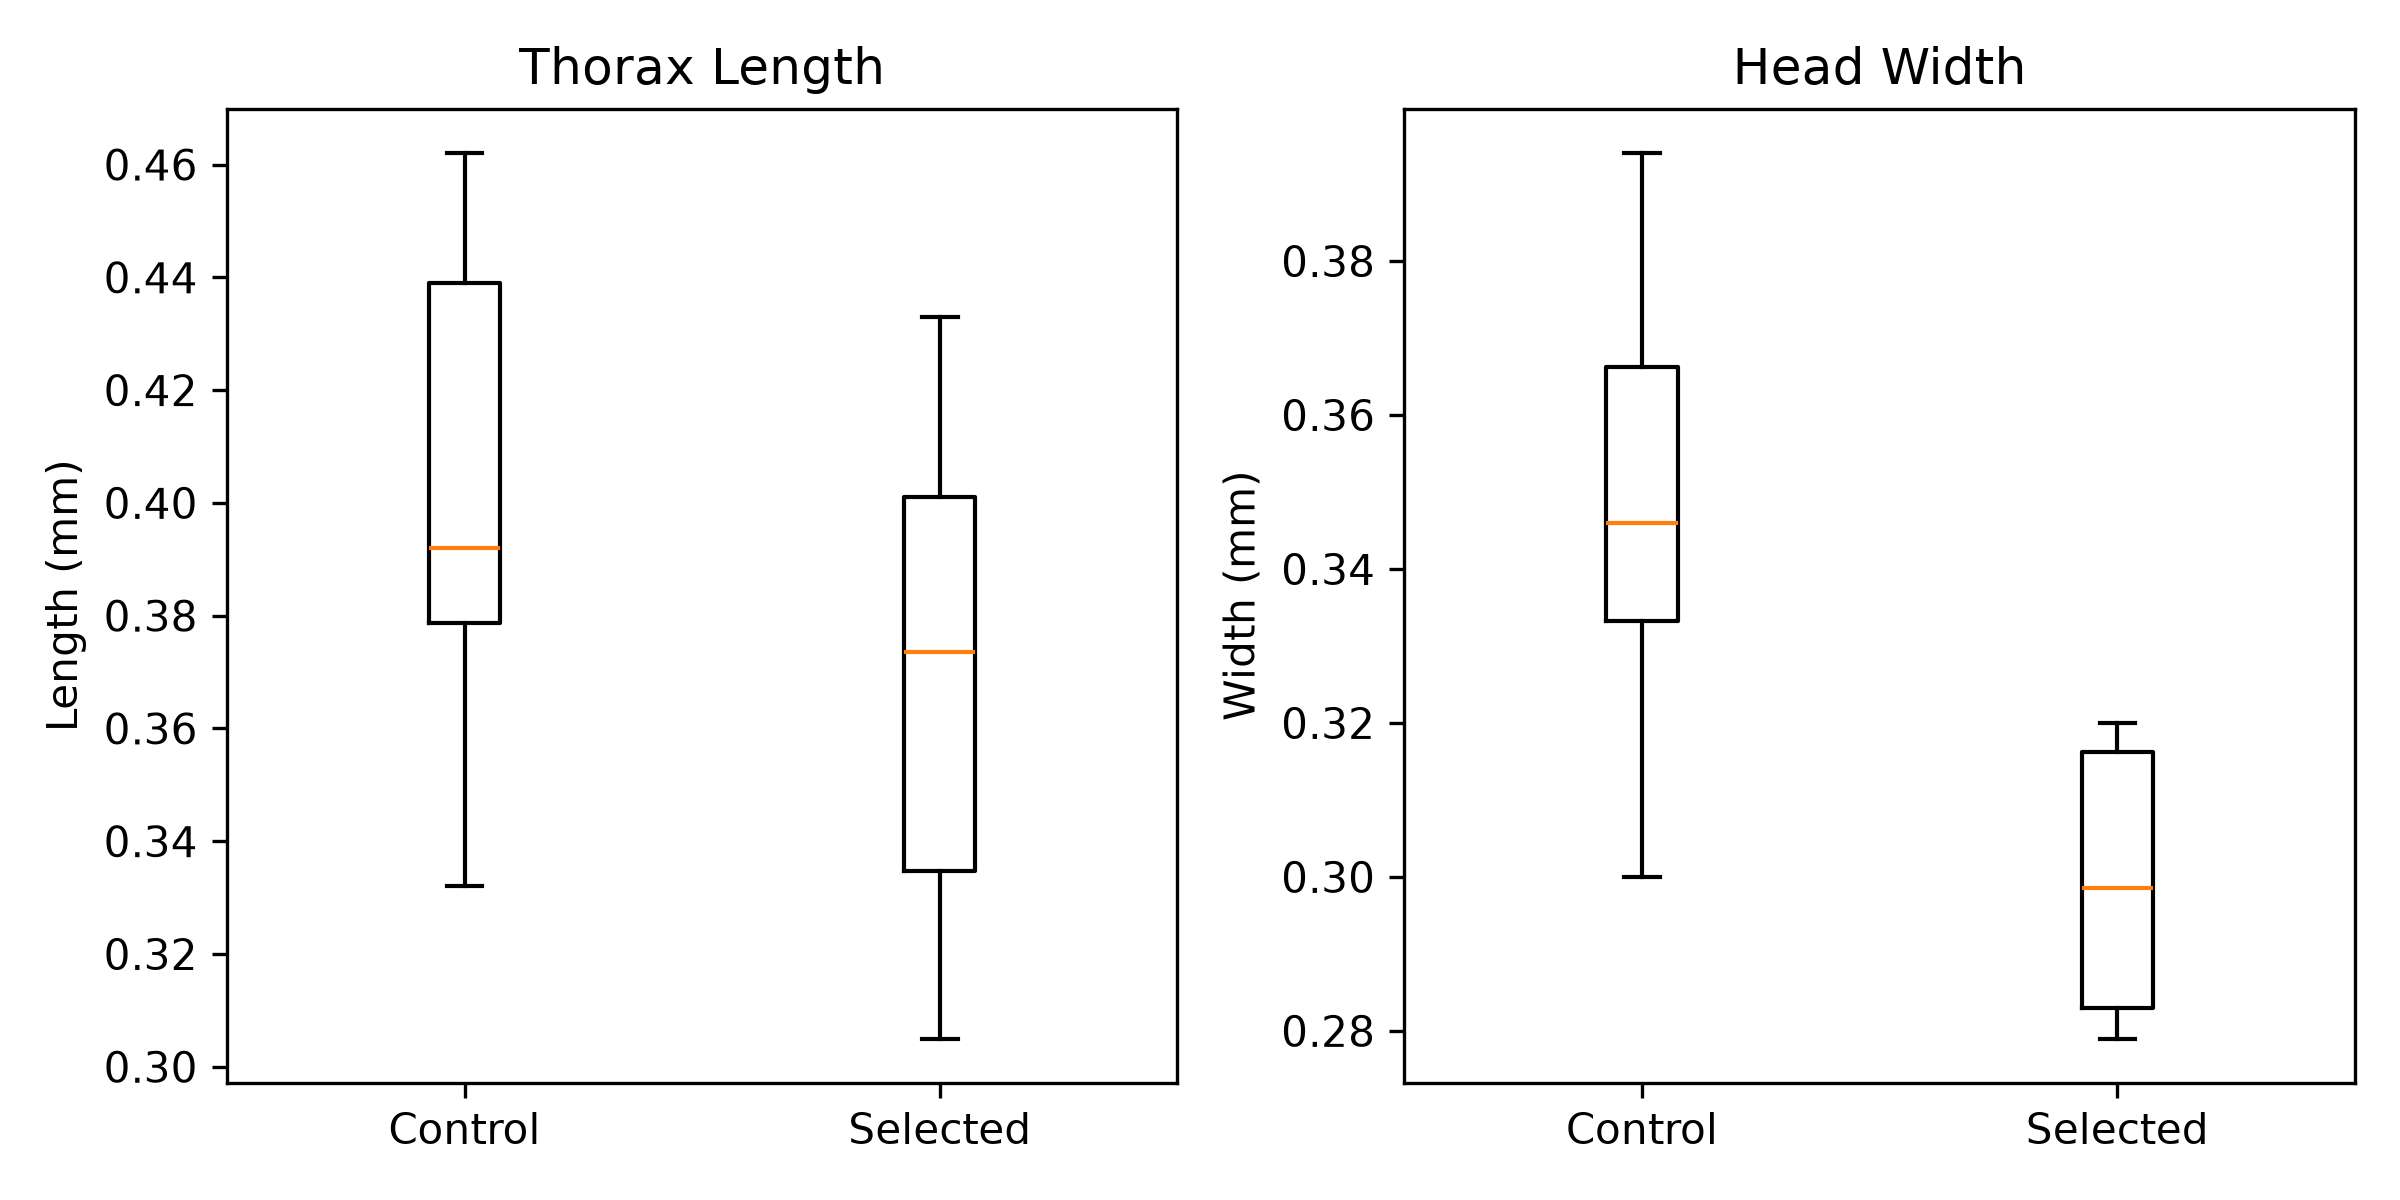
Figure: Distributions of thorax length and head width across treatment cohorts.
Head width exhibited severe, non-overlapping reduction: the lower quartile of control flies (0.333 mm) exceeded the upper quartile of malnourished flies (0.316 mm), demonstrating marked developmental canalization failure under nutritional starvation.
Geometric Morphometric Eigenanalysis
PCA resolved 18 principal components spanning the shape tangent space:
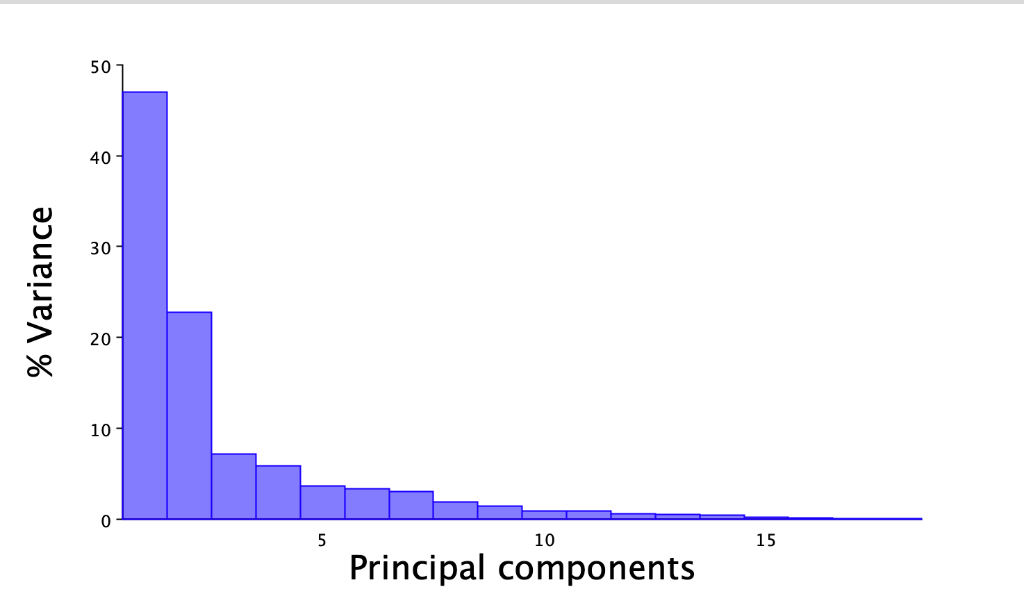
Figure: Scree plot of eigenvalues indicating percentage shape variance explained per PC.
- PC1: Accounts for 47.00% of total shape variance.
- PC2: Accounts for 22.75% of total shape variance.
- Combined, PC1 and PC2 explain 69.76% (~70%) of all shape divergence.
Shape Space Projections & Outlier Analysis
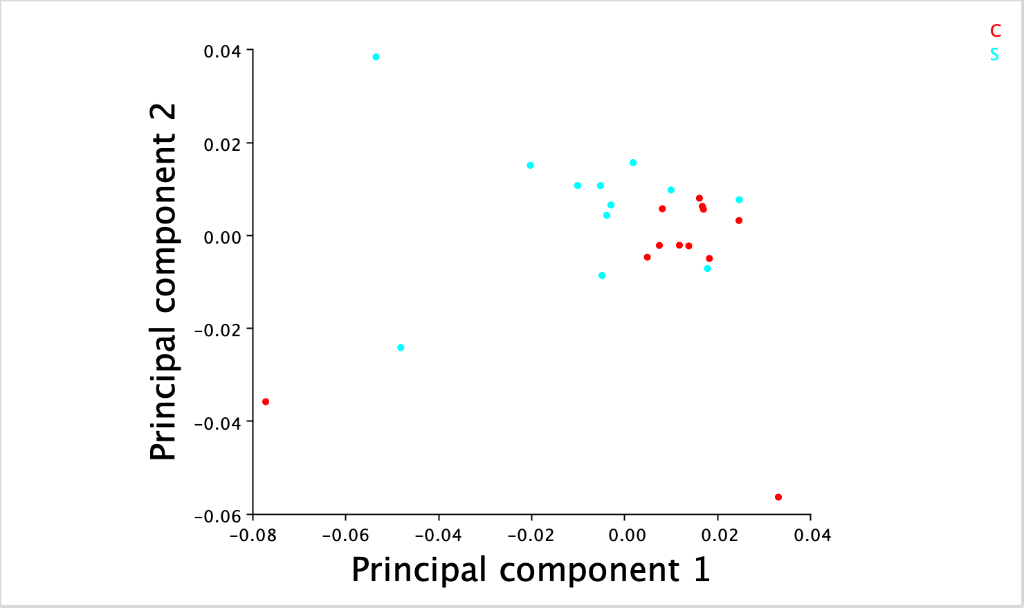 | 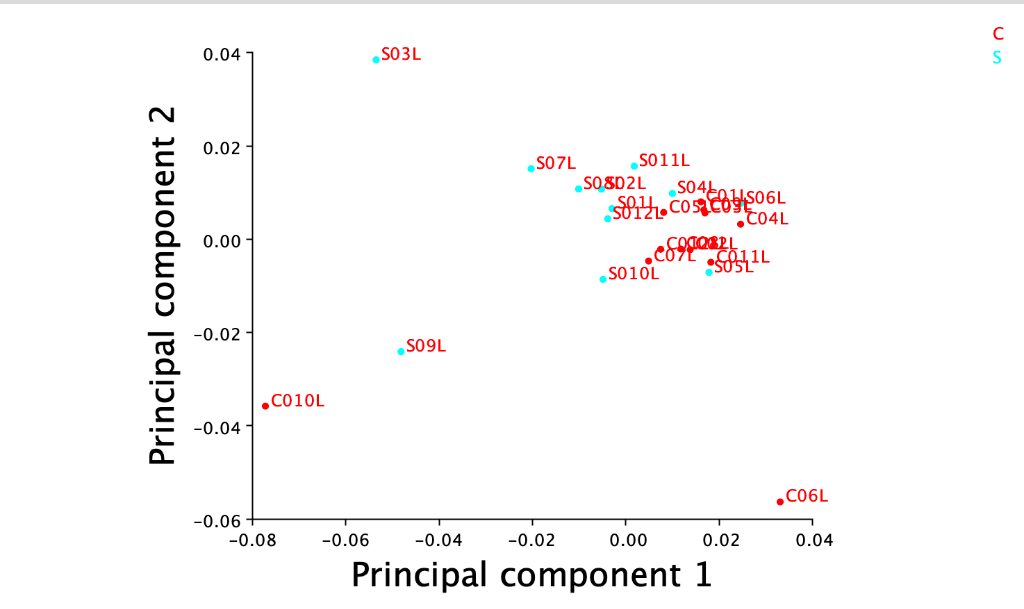 |
|---|---|
| PC1 vs PC2 scores: Control (red) vs Malnourished (cyan) | Individual specimen labels highlighting geometric outliers |
Four specimens (C010L, S03L, S09L, C06L) occupy extreme coordinates outside the main cluster due to localized mounting distortion or minor margin tearing at Landmark 1.
Evaluating the core cluster of 20 specimens reveals consistent subtle biological divergence:
- Control specimens: Predominantly positive PC1 scores (
). - Malnourished specimens: Predominantly negative PC1 scores (
).
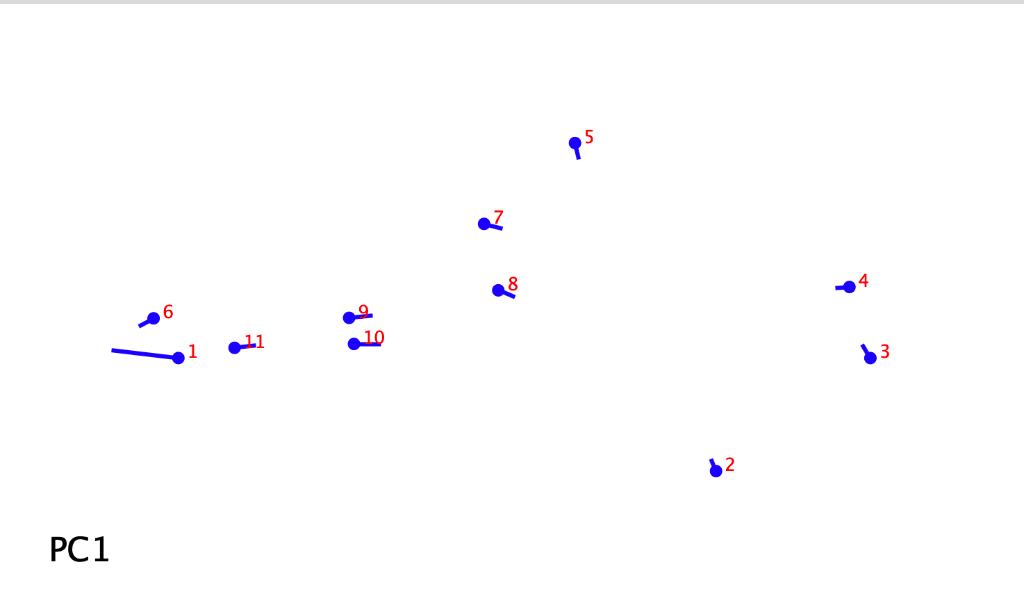
Figure: Landmark displacement vectors associated with Principal Component 1.
Eigenvector loadings indicate that PC1 is primarily driven by horizontal displacement of Landmark 1 (
Conclusion
Both geometric morphometrics and traditional linear measurements detected significant morphological divergence under starvation selection. While geometric morphometrics resolved subtle allometric wing shape deformations, traditional head width measurements exhibited stark, non-overlapping diagnostic separation, demonstrating that simple linear metrics remain exceptionally powerful and sensitive indicators of systemic developmental stress.
References
- Klingenberg, C.P. (2011). MorphoJ: an integrated software package for geometric morphometrics. Molecular Ecology Resources, 11(2), pp. 353–357.
- Zelditch, M.L., Swiderski, D.L. and Sheets, H.D. (2012). Geometric Morphometrics for Biologists: A Primer. Academic Press.