Deformities in C. elegans Intestine Due to Infection
Introduction
The aim of this experiment was to study the effect of bacterial infection on the morphology of Caenorhabditis elegans intestine. We used two different species of bacteria, Escherichia coli (strain OP50) and Pseudomonas aeruginosa (strain PA14). OP50 was the control, since it is the standard laboratory food for C. elegans. PA14 is known to be pathogenic to C. elegans. We infected L4 worms orally and observed the changes in their intestine after imaging with an epifluorescence microscope. We also performed a quantitative analysis of the intestinal morphology by calculating a deformation index for the intestine.
Materials and Methods
Materials
- C. elegans master plate
- 2 transfer plates with only agar
- 3 E. coli plates (GFP tagged)
- 3 P. aeruginosa plates (GFP tagged)
- Parafilm
- Two eyelash picks — made with eyelashes, toothpicks, 200 µL pipette tips, parafilm, and fevicol
- A dissecting microscope
- 3% agar
- Levamisole
- Glass slides and coverslips
- Epifluorescence microscope
- Incubator
Methods
Worm Picking
Using a master plate, we gently picked around 80 L4 worms using an eyelash pick and transferred them to a plain agar plate; 40 worms per plate. We left the worms on the plate for 20–30 minutes, so that the bacteria coating their body would be removed when they moved in the agar. The L4 worms were identifiable by a vulval opening. A dissection microscope was used to pick the worms.
Infection
We then transferred the worms to the experimental plates. For the control group, we transferred worms to three E. coli plates, 10 worms each. For the experimental group, we transferred worms to three P. aeruginosa plates, 10 worms each. We left the worms on the plates for 48 hours at 25°C.
Imaging
The worm intestines had been tagged with mCherry, and both bacteria were tagged with GFP. On a glass slide, we dropped some 3% agar to create a gel pad for the worms. The worms were anesthetized using levamisole, and a coverslip was placed on top. We imaged the worms using an epifluorescence microscope and captured the images at 40X magnification.
Results
 |  |
|---|---|
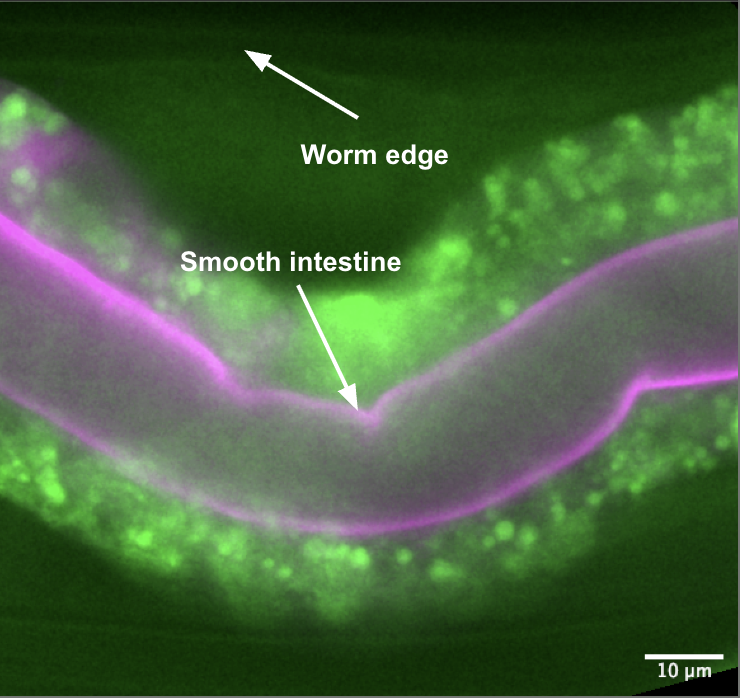
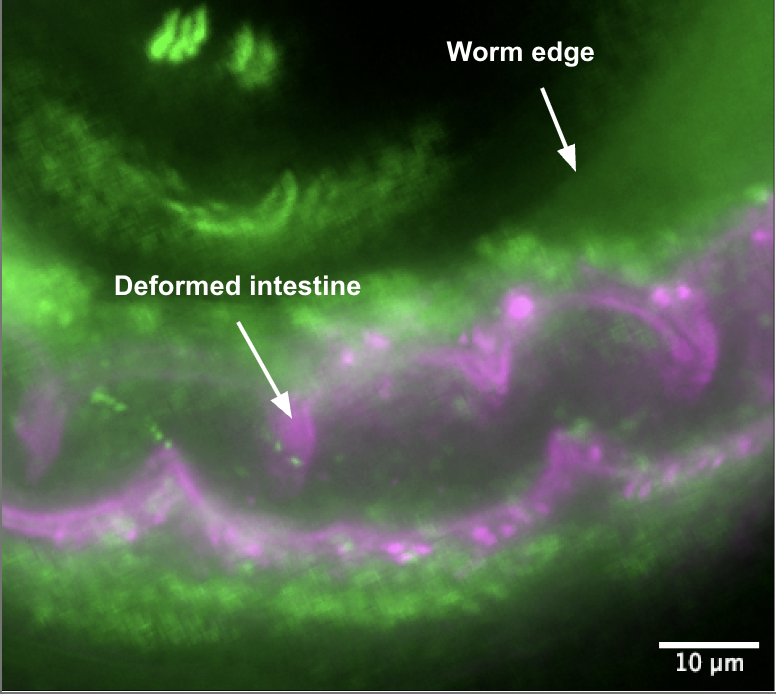
| Figure 1: Section of a C. elegans intestine fed E. coli OP50 (standard food). The intestine is mostly smooth, without kinks or inflammation. | Figure 2: Section of a C. elegans intestine fed pathogenic P. aeruginosa PA14. The intestine appears noticeably more swollen and deformed. |
Deformation Index
To quantify the degree to which the worm had been affected, we defined a "deformation index" (DI). This was calculated by taking the ratio of the length of the intestine to the length of the worm:
In case of no or minimal deformation, the worm length should be approximately equal to the length of the intestine, giving a ratio of around 1. In case of high deformation, the length of the intestine will be much longer than the length of the worm, resulting in a ratio significantly greater than 1.
Analysis
The images were analyzed using Fiji. We used the segmented line tool to trace the length of the intestine and the worm, and then obtained the length in pixels using the measure command. Three sections of each worm had been imaged. The DI for each section was calculated for the top and bottom respectively, yielding 6 DI values per worm. The average DI for each worm was then calculated (
| Bacteria | Average DI |
|---|---|
| OP50 | 1.0979 |
| OP50 | 1.1424 |
| OP50 | 1.1507 |
| PA14 | 1.0865 |
| PA14 | 1.5180 |
| PA14 | 1.5740 |
Graphical Distribution
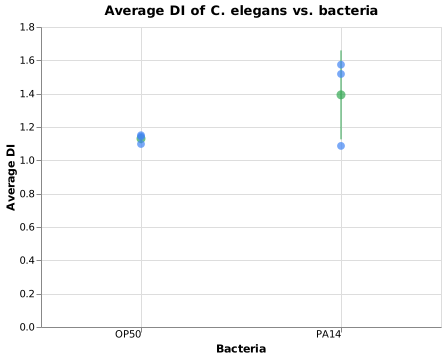
Figure 3: Average Deformation Index per worm. Individual replicates in blue; green coordinate indicates group mean
Statistical Significance
A one-tailed Welch's
: There is no significant difference between the intestinal DIs of worms fed the different bacteria. : - Significance Level:
Where
The degrees of freedom
From the
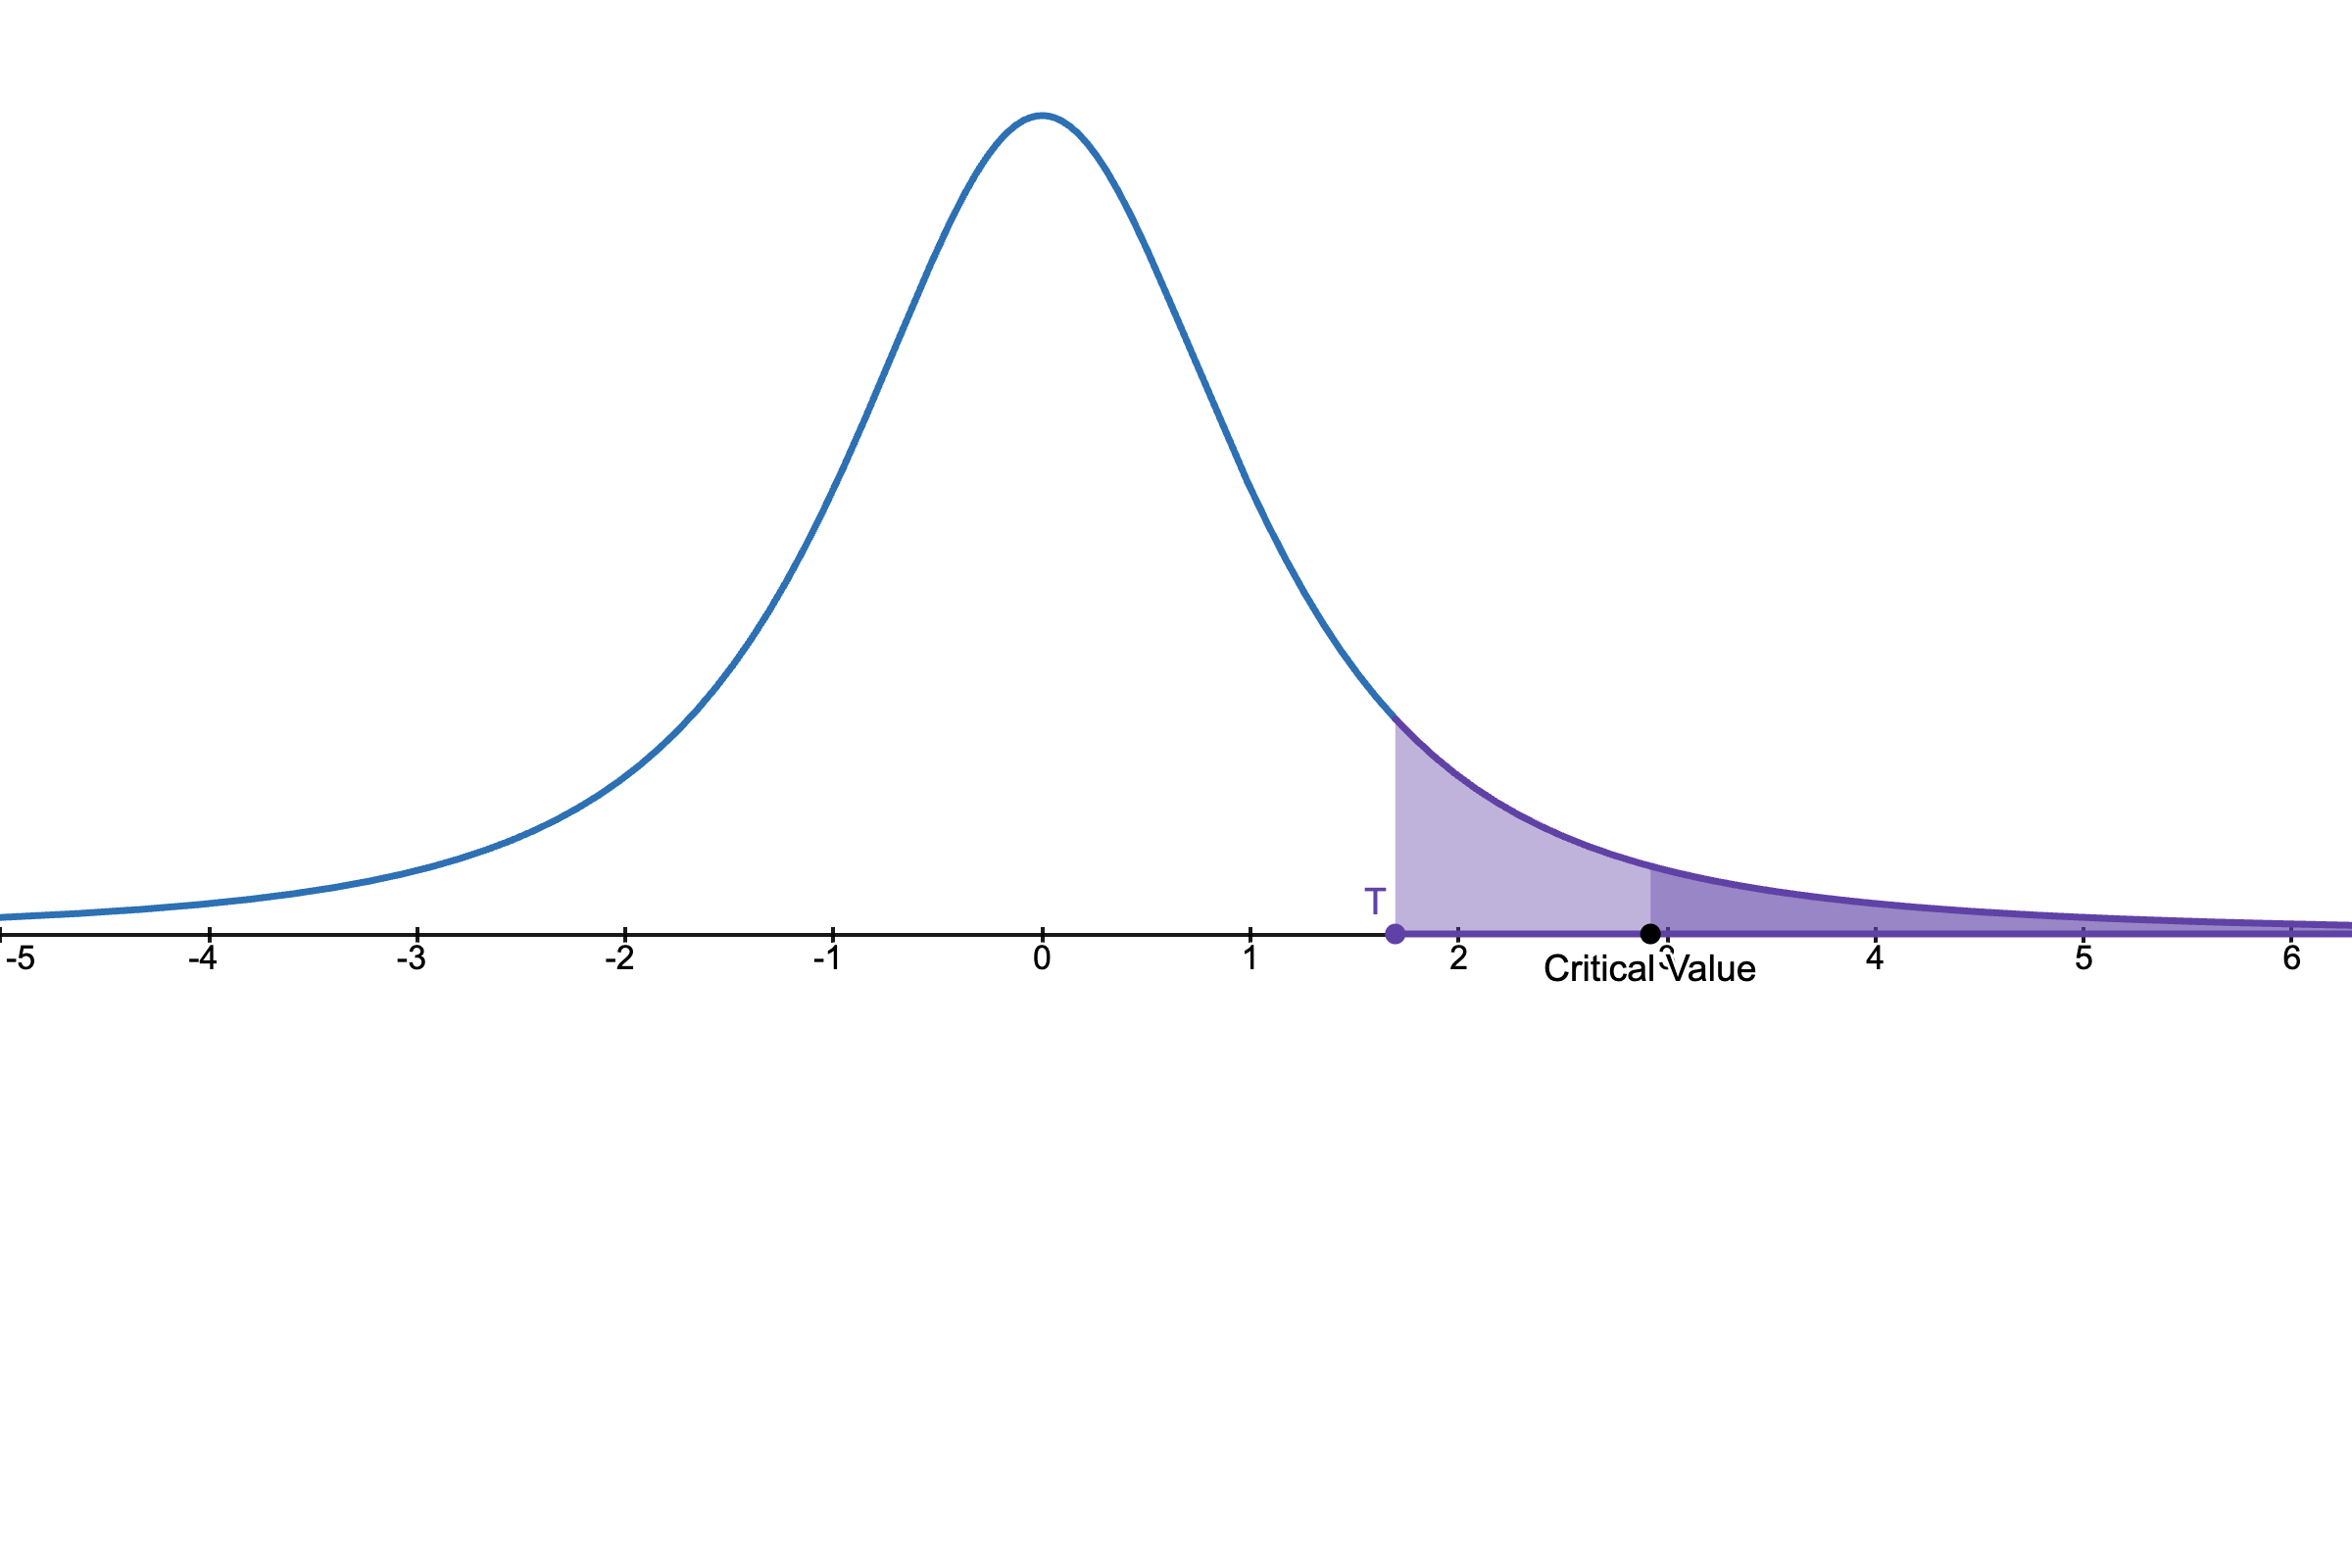
Figure 4:
Therefore, at
Discussion
Visibly, there appears to be a clear morphological difference between the intestines of the two groups of worms. However, the statistical analysis does not reject the null hypothesis, primarily attributable to the small sample size (
Additionally, worm stage staging errors during picking (e.g. mix of L3 and L4 worms maturing together over 48 hours) could introduce morphological variability.
NOTE
Biological Observations on Barrier Dysfunction:
In several images, ingested bacteria were observed outside the intestinal boundary in both OP50 and PA14 worms. Intestinal barrier dysfunction is an evolutionarily conserved hallmark of aging across organisms (Salazar et al., 2023), so bacteria outside the lumen in OP50 controls likely reflects senescence, whereas in PA14 worms it is directly attributable to pathogen-mediated epithelial damage (Tan et al., 1999).
References
- Cambridge International. List of Formulae and Statistical Tables. PDF link
- Desmos. t-distribution Calculator. Desmos
- Salazar, A.M., Aparicio, R., Clark, R.I., Rera, M. and Walker, D.W. (2023). Intestinal barrier dysfunction: an evolutionarily conserved hallmark of aging. Disease Models & Mechanisms, 16(4). DOI
- Tan, M.W., Rahme, L.G., Sternberg, P.W. and Ausubel, F.M. (1999). Pseudomonas aeruginosa killing of Caenorhabditis elegans used to identify P. aeruginosa virulence factors. PNAS, 96(5), pp. 2408–2413. DOI